Fast Food Statistics reveal the latest trends and insights shaping the U.S. fast food industry.
Whether you're a Restaurant Manager or industry professional, these insights provide a clear view of where fast food is headed and how you can stay competitive in 2025 and beyond.
Fast Food Statistics on Industry Performance & Market Outlook
The U.S. fast food and quick-service restaurant (QSR)* market is projected to grow from $311.54 billion in 2024 to $330.56 billion in 2025.
Looking ahead, the market could expand to $436.07 billion by 2029, accelerating to a 7.2% CAGR.
Source: Auguste Escoffier School of Culinary Arts
This growth is fueled by changing consumer lifestyles, increasing demand for convenience and innovative menu offerings.

The Fastest Growing
Restaurant & Hospitality Job Platform
Looking for top paid jobs? Or Hiring for your business?
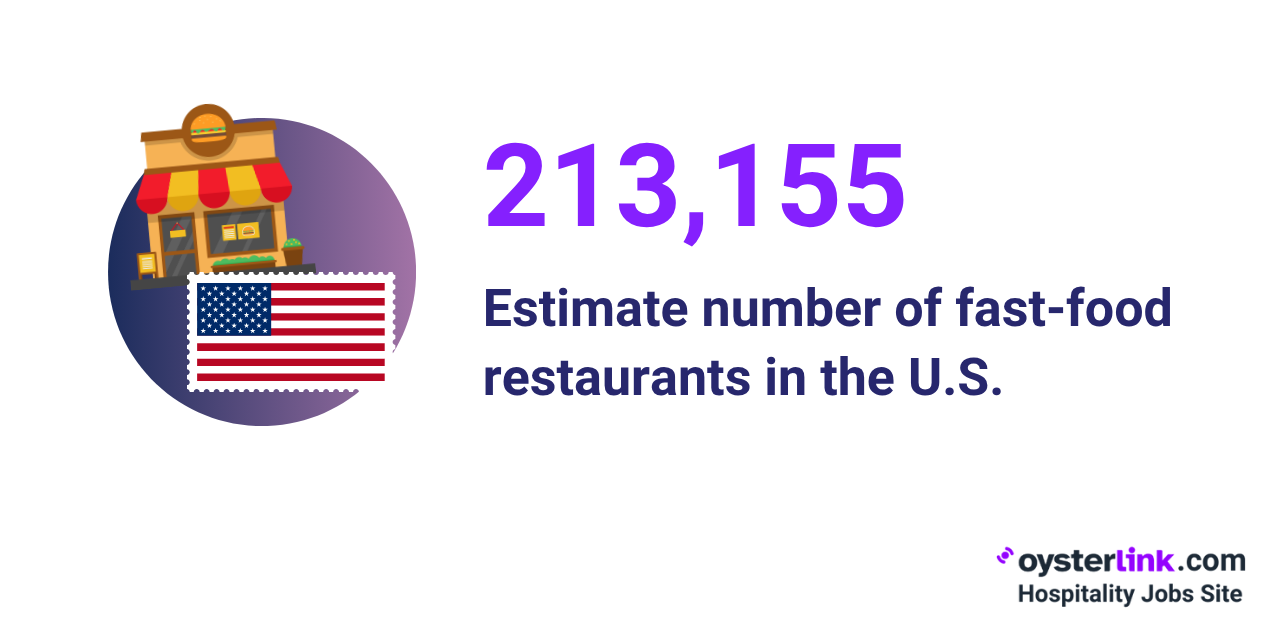
Recent data shows there are over 213,155 fast food restaurants operating across the U.S.
McDonald's, for instance, plans to open 900 new locations across the U.S. by 2027, accompanied by an initiative to onboard up to 375,000 workers during the summer.
In addition, the number of franchised fast food restaurants is expected to grow by 2.2% in 2025 — reaching an estimated 204,366 locations.
For a closer look at the brands driving this growth, don’t miss our feature on the 20+ Fastest-Growing Restaurant Chains in 2025.
Fast Food Workforce Statistics and Employment Trends
Understanding employment patterns and labor issues is key to understanding this industry’s workforce.
The U.S. fast food industry currently has approximately 3,780,930 people employed.
.png)
Employment in this industry is forecasted to grow 5% over the next 10 years. This growth rate is slightly faster than the average 4% for all occupations.
Around 67.1% of Fast Food Workers are employed part-time, while only 32.9% hold full-time positions.
Employee gender demographics: Among those working in the fast food industry, 64.8% are women and 35.2% are men.
Around 53.3% of women in fast-food jobs work part-time and 20.3% full-time. As for men, 13.7% work part-time and 12.6% work full-time.
The majority of Fast-Food Workers (68.4%) are aged 16 to 24. The next-largest group is those aged 25 to 34, who make up 16.5% of the workforce.
Most employees in the fast food industry (29.54%) have a high school diploma or GED.
Meanwhile, only 5.61% have an associate’s degree, and 7.21% hold a bachelor’s degree. An additional 29.47% have some college education but no degree.
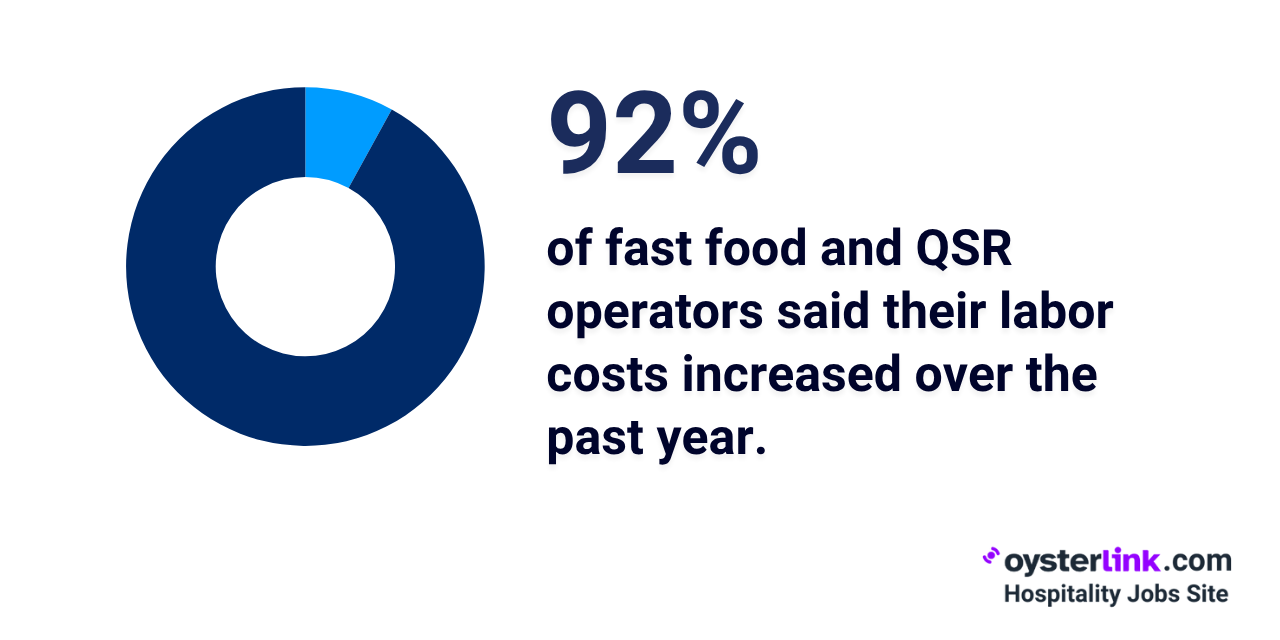
About 92% of QSR operators reported increased labor costs in the past year, with 89% expecting further increases in the next 12 months.
The Fastest Growing
Restaurant & Hospitality Job Platform
Looking for top paid jobs? Or Hiring for your business?
Fast Food Statistics on Wages and Pay Trends
Fast-Food Workers in the U.S. typically earn $15.07 per hour (before tips) or $31,350 a year.
The current pay for Fast-Food Workers is around 33.7% higher than what it was five years ago.
The top 10% (or 90th percentile) of Fast-Food Workers earn around $18.65 per hour (before tips) or $38,800 a year.
Those working in fast food places and QSRs in the District of Columbia ($19.65), California ($18.97) and Washington ($18.82) typically earn the highest base wages.
| State/District | Average wage (before tips) |
| District of Columbia | $19.65 per hour |
| California | $18.97 per hour |
| Washington | $18.82 per hour |
| Vermont | $18.10 per hour |
| New York | $17.45 per hour |
Fast-Food Workers are likely to earn the highest salaries in metro areas in the Bay Area in California — specifically, San Jose-Sunnyvale-Santa Clara ($20.83).
| Statistical area | Average wage (before tips) |
| San Jose-Sunnyvale-Santa Clara, CA | $20.83 per hour |
| San Francisco-Oakland-Fremont, CA | $20.67 per hour |
| Napa, CA | $19.75 per hour |
| Seattle-Tacoma-Bellevue, WA | $19.74 per hour |
| Santa Rosa-Petaluma, CA | $19.46 per hour |
Want to know if other hospitality jobs pay more? See Hospitality Wages & Salaries: 2025 Data and Trends
Fast Food Statistics by Consumer Demographics and Menu Preferences
Fast food consumption patterns vary widely across age, gender and lifestyle, driven by evolving preferences and habits that influence how and when people choose to eat fast food.
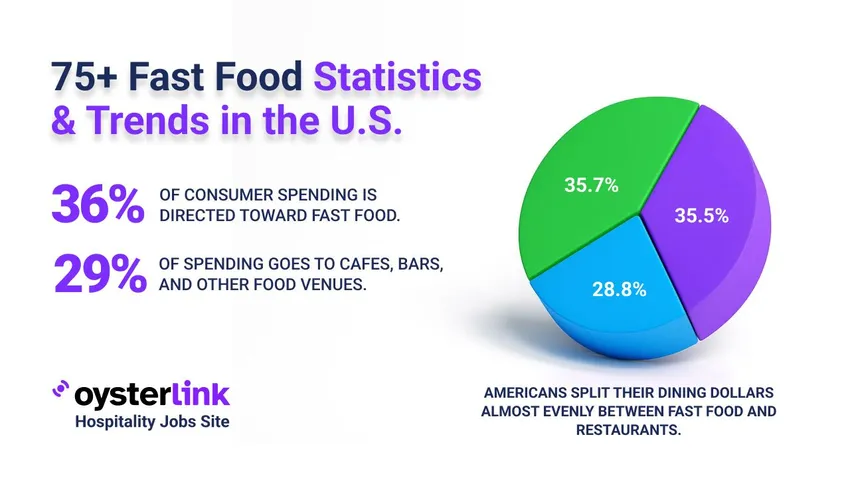
Fast food and QSRs accounted for 35.7% of consumers’ FAFH spending in 2024, followed closely by full-service restaurants at 35.5%.
Fast food consumption frequency: Roughly 2 out of 3 people in the U.S. eat fast food at least once a week (65%).
Sales at limited-service restaurants in the U.S. often peak in the summer. In 2024, average daily sales peaked in June ($1.58 billion) and were lowest in January ($1.33 billion).
Adults aged 20 to 39 years old are the most frequent consumers of fast food in the U.S. About 44.9% of individuals in this age group consumed fast food on any given day in 2024.
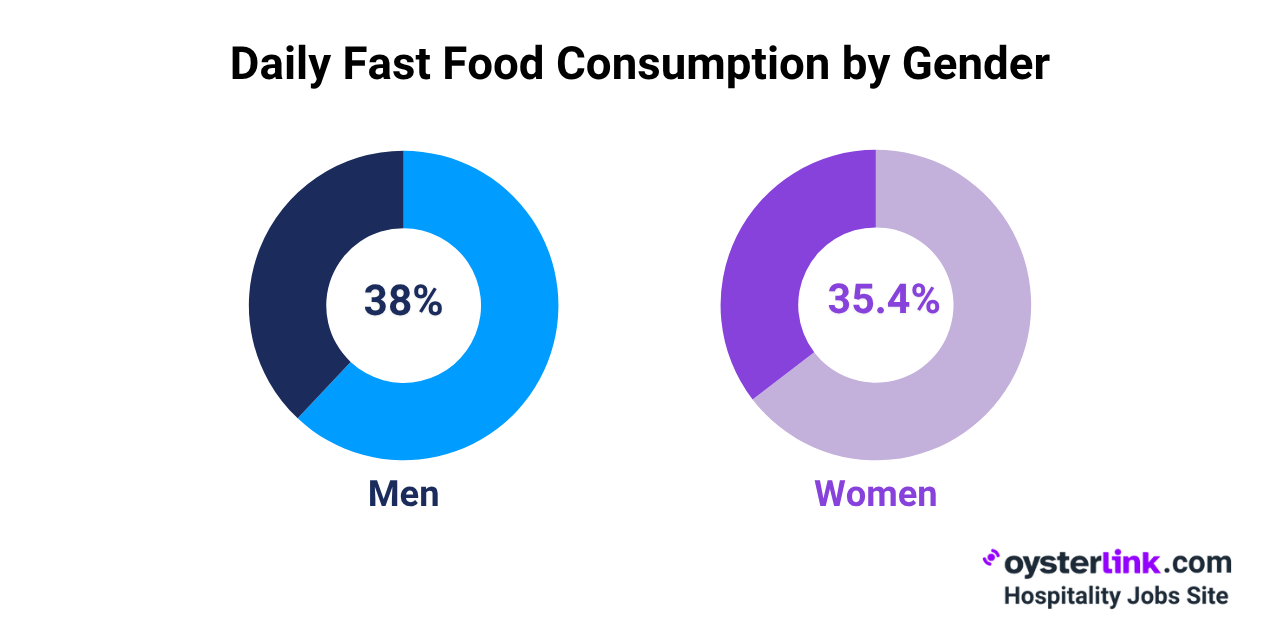
Men are more likely than women to consume fast food regularly. Approximately 38% of men and 35.4% of women ate fast food on a given day.
Lunch is the most common time for fast food consumption, with 43.7% of adults saying they eat it then.
Dinner follows at 42%, while breakfast and snacks account for 22.7% and 22.6%, respectively.
Monthly spending: On average, Americans spend around $148 on fast food each month.
Check Our Career Growth Tools
Among all major U.S. cities, San Francisco has the highest average cost for a fast food meal at $13.88.
Fast food consumption rises with income, according to federal data.
About 31.7% of lower-income adults eat fast food daily, compared to 36.4% of middle-income and 42% of higher-income adults.
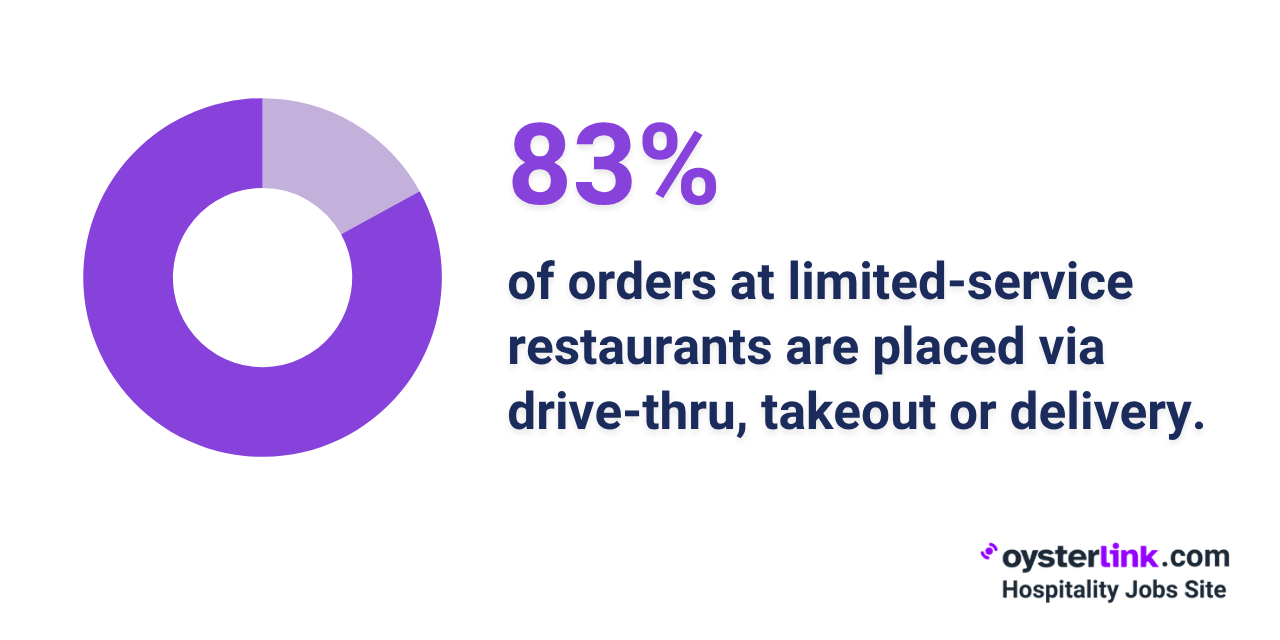
Drive-thru, takeout and delivery now account for 83% of all orders at fast food places and other limited-service restaurants.
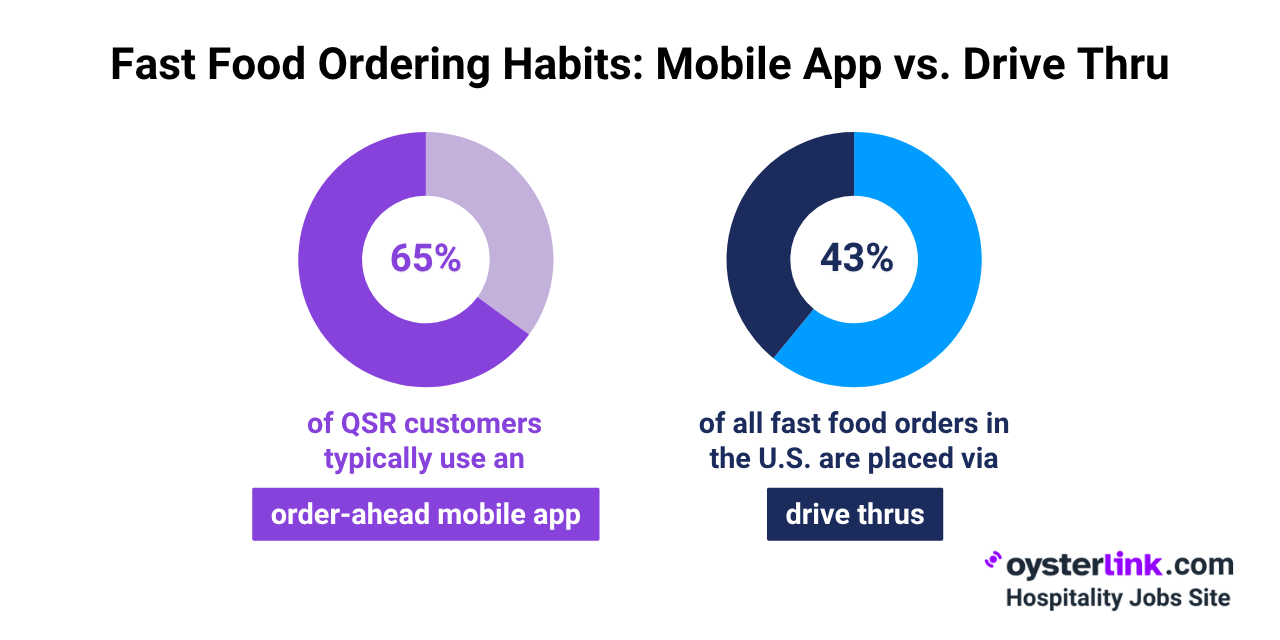
Around 65% of QSR visitors have used an order-ahead app, including nearly 90% of those aged 18 to 24.
Approximately 43% of U.S. fast-food orders are placed at drive-thrus, totaling around $140 billion annually.
Digital orders boost spending - customers spend 26% more per transaction at QSRs when ordering through websites or apps.
Customers in the U.S. tend to spend around 20% more when ordering delivery than on takeout or pickup.
Consumers are increasingly seeking healthier fast food options. Chains are responding by offering lower-calorie menu alternatives and fresh, whole-food ingredients.
The global vegan fast food market is projected to grow from $24.11 billion in 2023 to $70.42 billion by 2033, at a CAGR of 11.31% during the projected period.
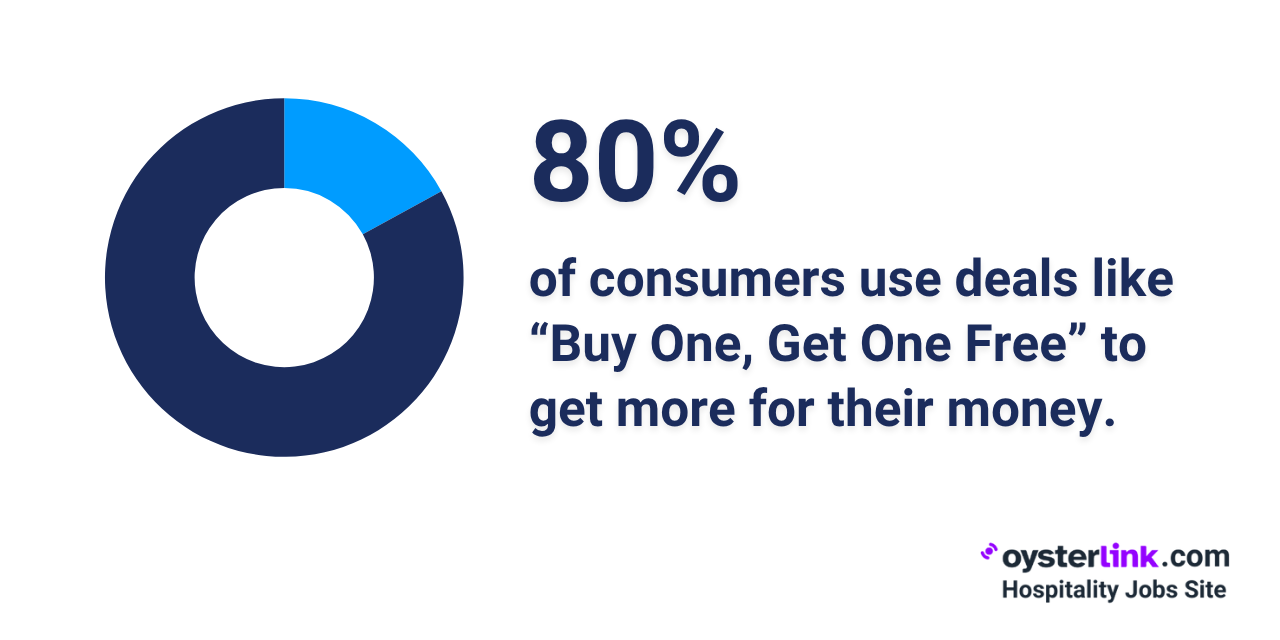
Promotional deals and loyalty programs significantly influence dining decisions, with 80% of consumers utilizing offers like “Buy One, Get One Free.”
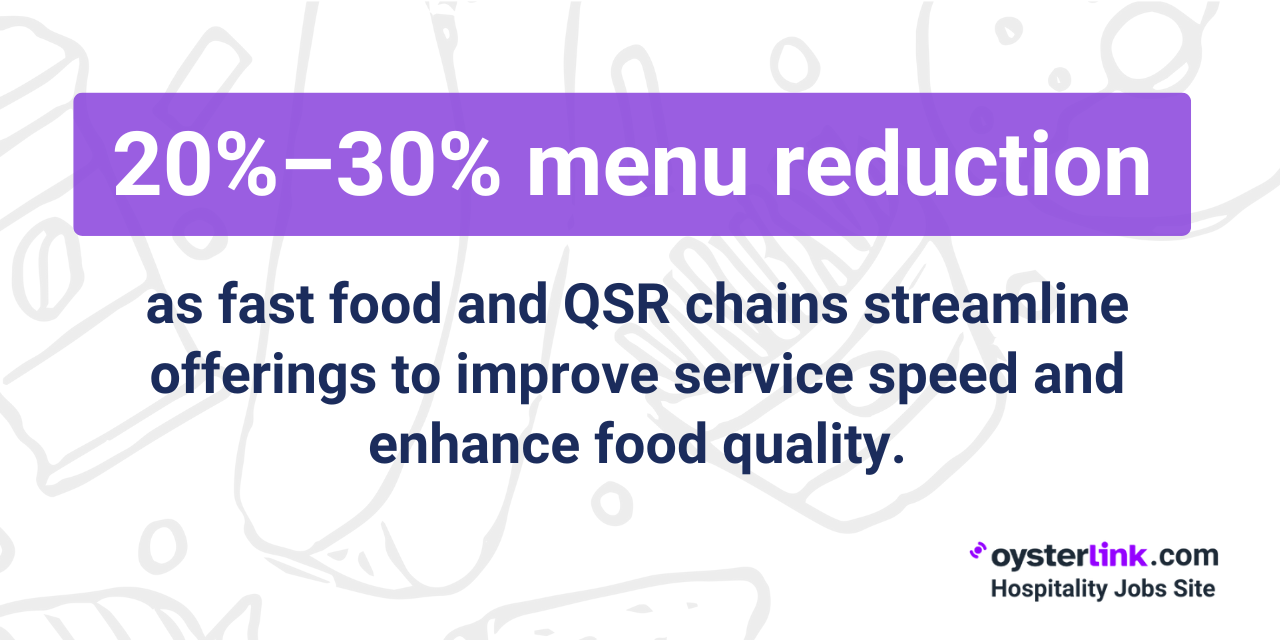
Many U.S.-based QSR chains are reducing their menu items by 20%–30% to speed up service and improve quality.
Most popular menu category: Burgers made up 42% of all revenue in the U.S. fast food industry in 2024 — making these the top-selling food item.
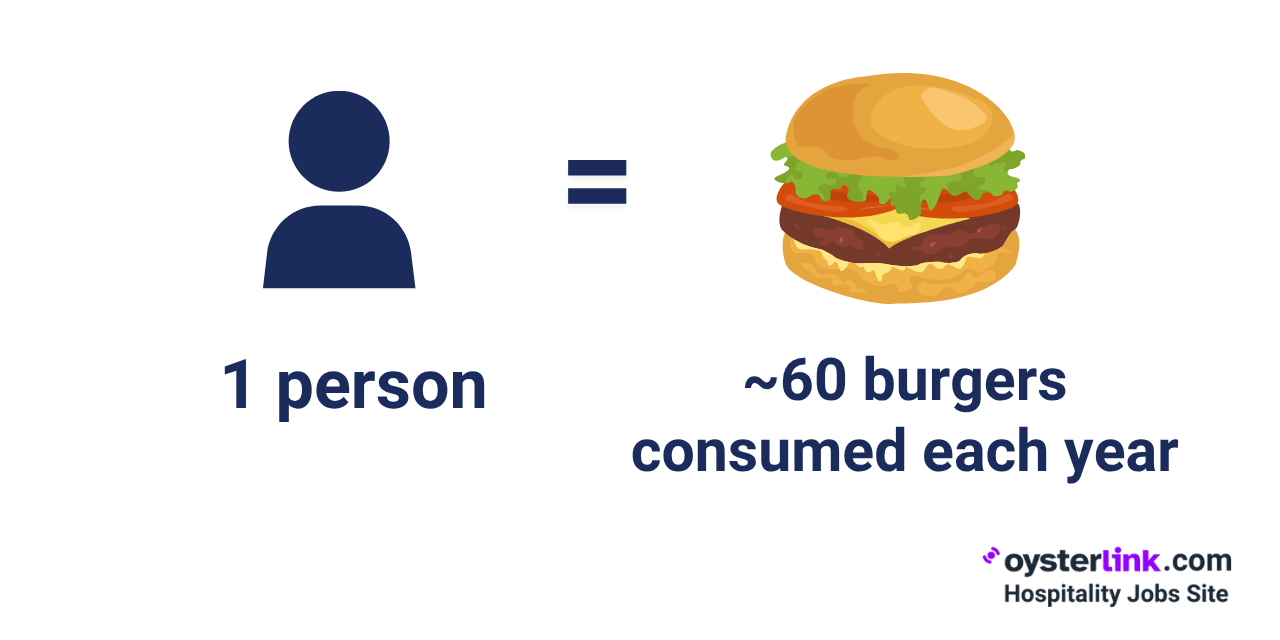
Burger consumption stats: Each year, U.S. consumers eat around 20 billion burgers, which breaks down to about 60 burgers per person.
Nearly 40% of people say they’d visit fast food and QSRs more often if those places used more sustainable packaging.
Industry response to eco demand: About 65% of fast food and QSRs have already started using some form of eco-friendly packaging.
The Fastest Growing
Restaurant & Hospitality Job Platform
Looking for top paid jobs? Or Hiring for your business?
Fast Food Statistics on Innovation & Technology Integration
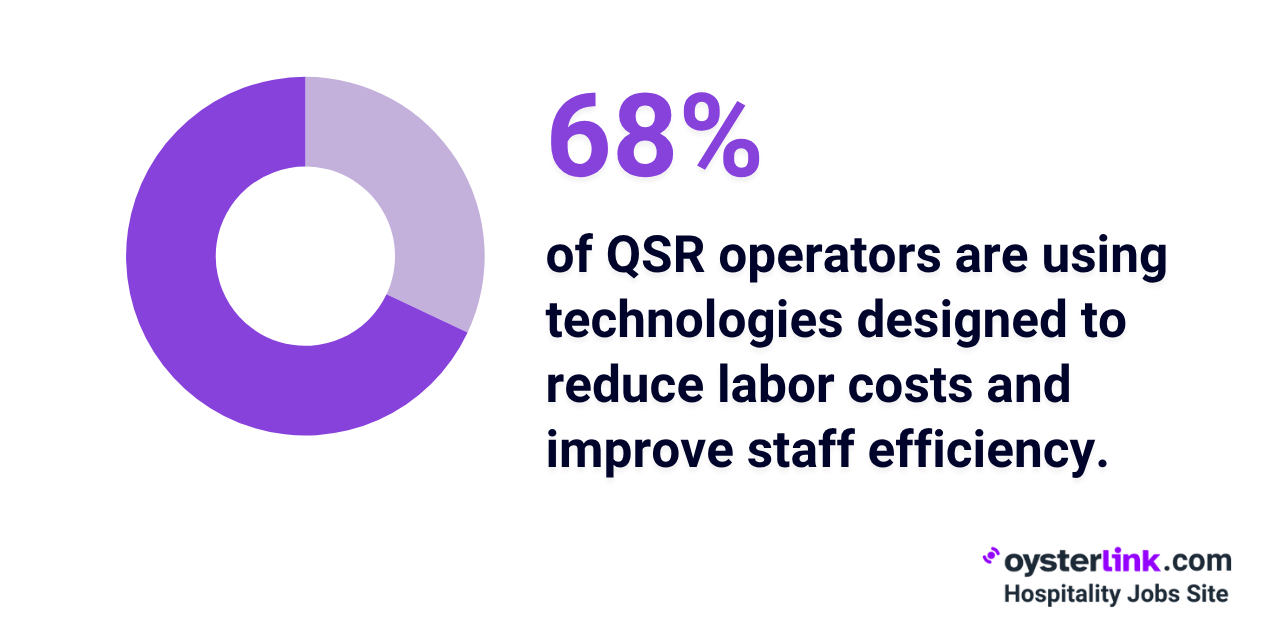
About 68% of QSR operators are adopting labor-focused technologies.
AI and robotics are helping reduce costs by as much as 50% by boosting efficiency and easing the impact of labor shortages.
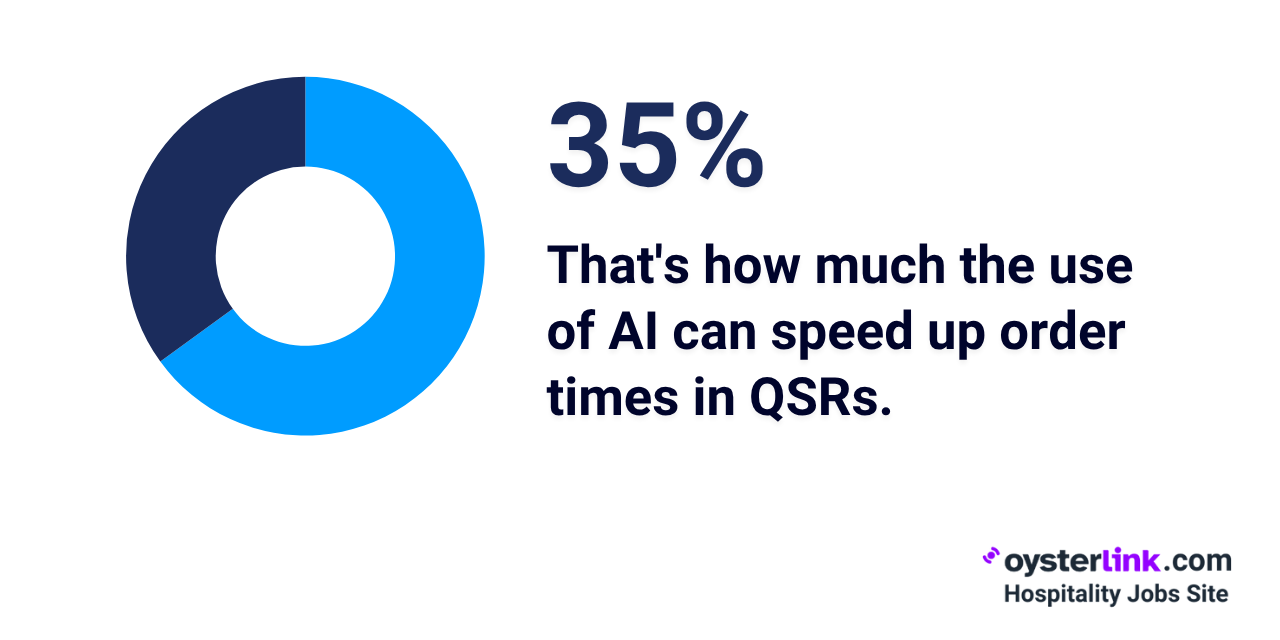
Using AI tools in QSRs can make the ordering process up to 35% faster, helping customers get their food more quickly.
Self-order kiosks: These have been adopted in over 30% of U.S. fast food locations and are expected to increase to 50% by 2026.
AI voice ordering systems are cutting service times by 11.5 seconds on average, thanks to fewer order errors.
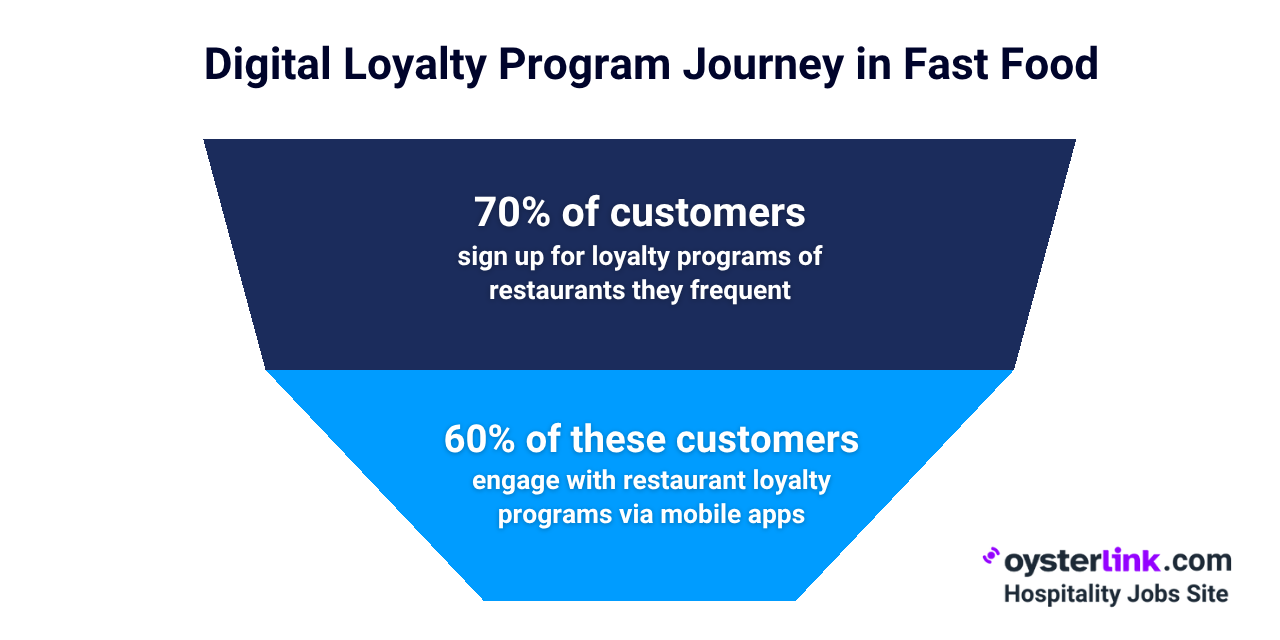
Over 70% of QSR customers participate in digital loyalty programs of some of the restaurants they frequent.
Around 60% of these customers engage with loyalty programs through mobile apps.
Pizza Hut became the first U.S. restaurant brand to successfully launch and maintain a mobile app, which hit 100,000 downloads in two weeks.
Beyond order taking, AI is being used to predict customer traffic and manage inventory more efficiently. In the kitchen, automation helps speed up operations.
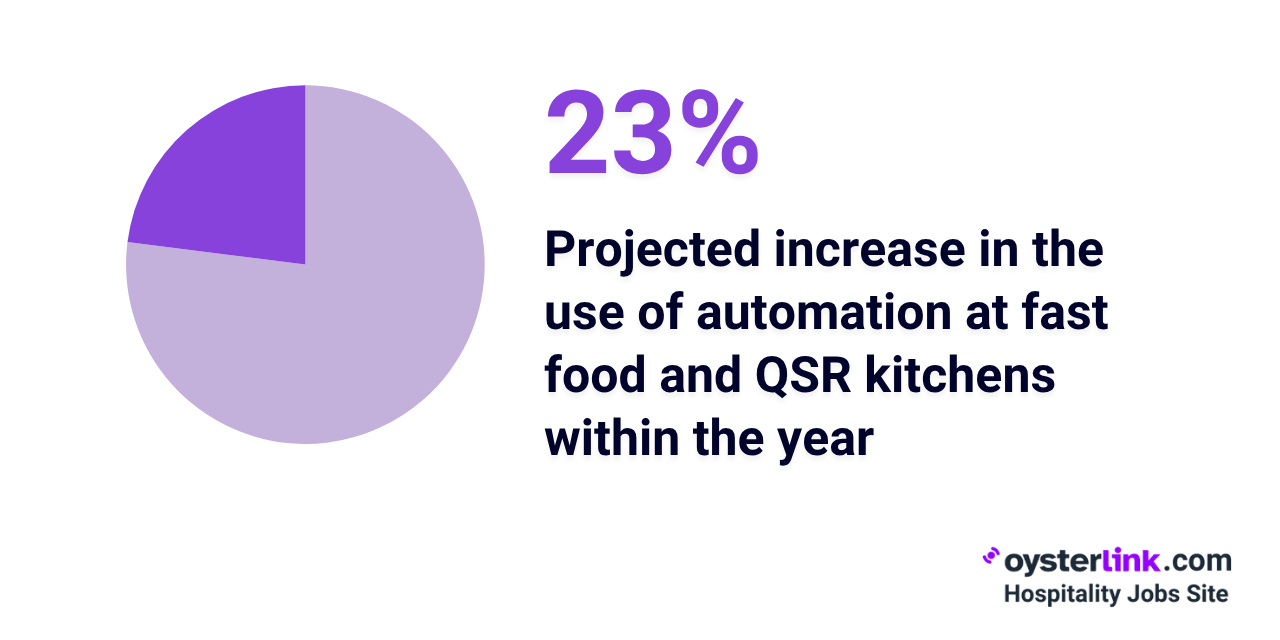
Automation in QSR kitchens — including cooking and prep robots — is growing fast, with a 23% increase projected through 2025.
More brands have been testing robotic employees, which could cut costs and save time in the future.
Chains like CaliBurger and White Castle deploy robotic fryers and burger-flipping machines, with plans for wider rollout in the next three to five years.
Fast Food Statistics 2025: Final Insights & Conclusion
The future of fast food in the U.S. is (and will be) shaped by technological advances, demographic changes and evolving consumer expectations.
While challenges like labor shortages and rising costs remain, the industry is responding with automation, digital tools and a stronger focus on convenience.
At OysterLink, we help hospitality employers find and connect with the talent they need to stay competitive and succeed in tomorrow’s fast-paced market.
The Fastest Growing
Restaurant & Hospitality Job Platform
Looking for top paid jobs? Or Hiring for your business?


Loading comments...