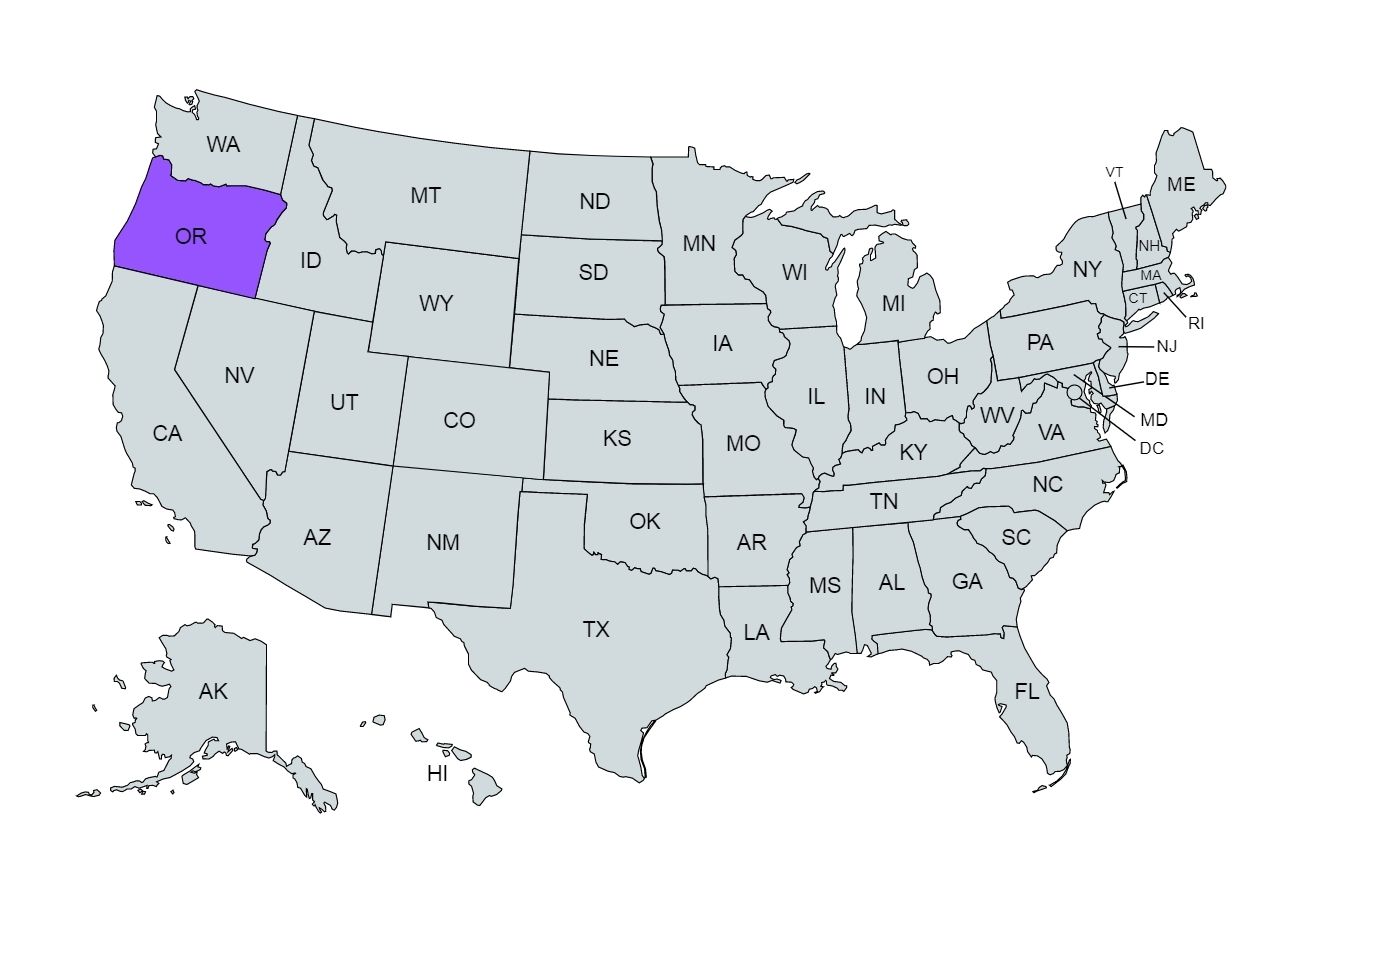
If you’re wondering, “How do I figure out how much money I take home in Oregon?” we’ve got you covered.
Use our simple paycheck calculator to estimate your net or “take home” pay after taxes, as an hourly or salaried employee in Oregon.
Paycheck Calculator
Disclaimer: Please note that this paycheck calculator is designed to provide an estimate and should not be considered as professional tax advice. The actual withholding amounts and taxes owed may vary depending on individual circumstances and other factors. For accurate and personalized tax advice, we recommend consulting with a tax professional.
If your gross pay is 0 per - in the state of F, your net pay (or take home pay) will be $1,343.17 after tax deductions of 0% (or $ 156.83). Deductions include a total of [1] 0% (or $0.00) for the federal income tax, [2] 0% (or $0.00) for the state income tax, [3] 6.20% (or $0.00) for the social security tax and [4] 1.45% (or $0.00) for Medicare.
The Federal Income Tax is collected by the government and is consistent across all U.S. regions. In contrast, the State Income Tax is levied by the state of residence and work, leading to substantial variations. The Social Security Tax is used to fund Social Security, which benefits retirees, persons with disabilities and survivors of deceased workers. Medicare involves a federal payroll tax designated for the Medicare insurance program. As of 2022, Alaska, Florida, Nevada, New Hampshire, South Dakota, Tennessee, Texas, Washington and Wyoming do not levy a state income tax.
How Does the Paycheck Calculator Work?
Input your salary information, such as wage and pay frequency, and our tool will handle the tax calculations for you. Once you’ve filled in all the information, click the “Calculate Tax” button, and the calculator will provide an estimate of your net or “take home” pay for the specified pay period.
Overview of Oregon Taxes
As of 2021, Oregon’s Gross Domestic Product (GDP) reached $270.12 billion, making it the 25th wealthiest state in the United States by GDP.
Additionally, as of November 2021, the state’s unemployment rate stood at 4.2%, ranking 37th in the nation for unemployment. These economic indicators reflect Oregon’s ongoing efforts to diversify and strengthen its economy beyond its historical reliance on natural resources.

If you decide to start a new job in the “Beaver State”, here’s what to expect tax-wise.
Oregon has a progressive state income tax system, featuring a top rate of 9.90%, which is one of the highest in the U.S. However, Oregon stands out for not having sales taxes and maintaining property taxes below the national average.
Social Security tax amounts to 6.2% of your wages, while Medicare tax is 1.45%. Your employer matches these contributions, doubling the total amount paid. For earnings exceeding $200,000, there is a 0.9% Medicare surtax, but employers do not match this surtax.
Contributions to retirement plans such as a 401(k) or medical expense accounts like health savings accounts (HSAs) are also deducted from your paychecks. These accounts utilize pre-tax funds, reducing your taxable income while securing your financial future, particularly in the case of retirement accounts.
Oregon’s tax situation can be favorable due to the absence of a state sales tax but less appealing for higher-income individuals due to a relatively high state income tax rate.
Median Household Income in Oregon
Salary in each state is typically based off the cost of living. While salaries vary widely based on position, the median household income in your state can give you a glimpse at the average salary a household is earning in your region.
| Year | Median Household Income |
|---|---|
| 2021 | $71,562 |
| 2020 | $65,667 |
| 2019 | $67,058 |
| 2018 | $63,426 |
| 2017 | $60,212 |
| 2016 | $57,532 |
| 2015 | $54,148 |
| 2014 | $51,075 |
| 2013 | $50,251 |
| 2012 | $49,161 |
| 2011 | $46,816 |
The median household income data for the years from 2011 to 2021, shows the income increasing steadily from $46,816 in 2011 to $71,562 in 2021, with some fluctuations in between.
While there is an overall upward trend, there are fluctuations in income from year to year, with some years experiencing more significant increases than others.
There is a noticeable jump from $57,532 in 2016 to $60,212 in 2017 and a more significant increase from $65,667 in 2020 to $71,562 in 2021, possibly influenced by factors like economic recovery and government stimulus measures during the COVID-19 pandemic.
Tips for Maximizing Your Paycheck
Here are some tips to help you maximize your paycheck:
- Become familiar with your payroll deductions
- Understand techniques for reducing your tax
- Fully utilize your work-related perks
- Develop a financial plan and define financial goal
- Look into additional income through extra hours or performance incentives
- Regularly check your pay stubs for inaccuracies
For a better understanding, check out our guide on how to keep more out of your paycheck.