20 Must-Know Statistics About Dishwashers – 2026
If you want to get a better insight into the role of Dishwasher — including gender, age and tenure statistics — we’ve prepared an awesome article that will answer all of your questions.
- Mississippi ($23,250) and Louisiana ($24,090) offer the lowest yearly wages for Dishwashers
- Typically, the highest Dishwasher salaries ($40,090) are in the event management sector
- On average, Dishwashers with a high school diploma make $893 more yearly in comparison to those who don’t have any school background
- A staggering 78% of the workforce is employed in private companies
- The largest portion of Dishwashers work in the hospitality field (57%)
- The current unemployment rate sits at 16% (and it’s projected to decline)
Dishwasher Employment Statistics
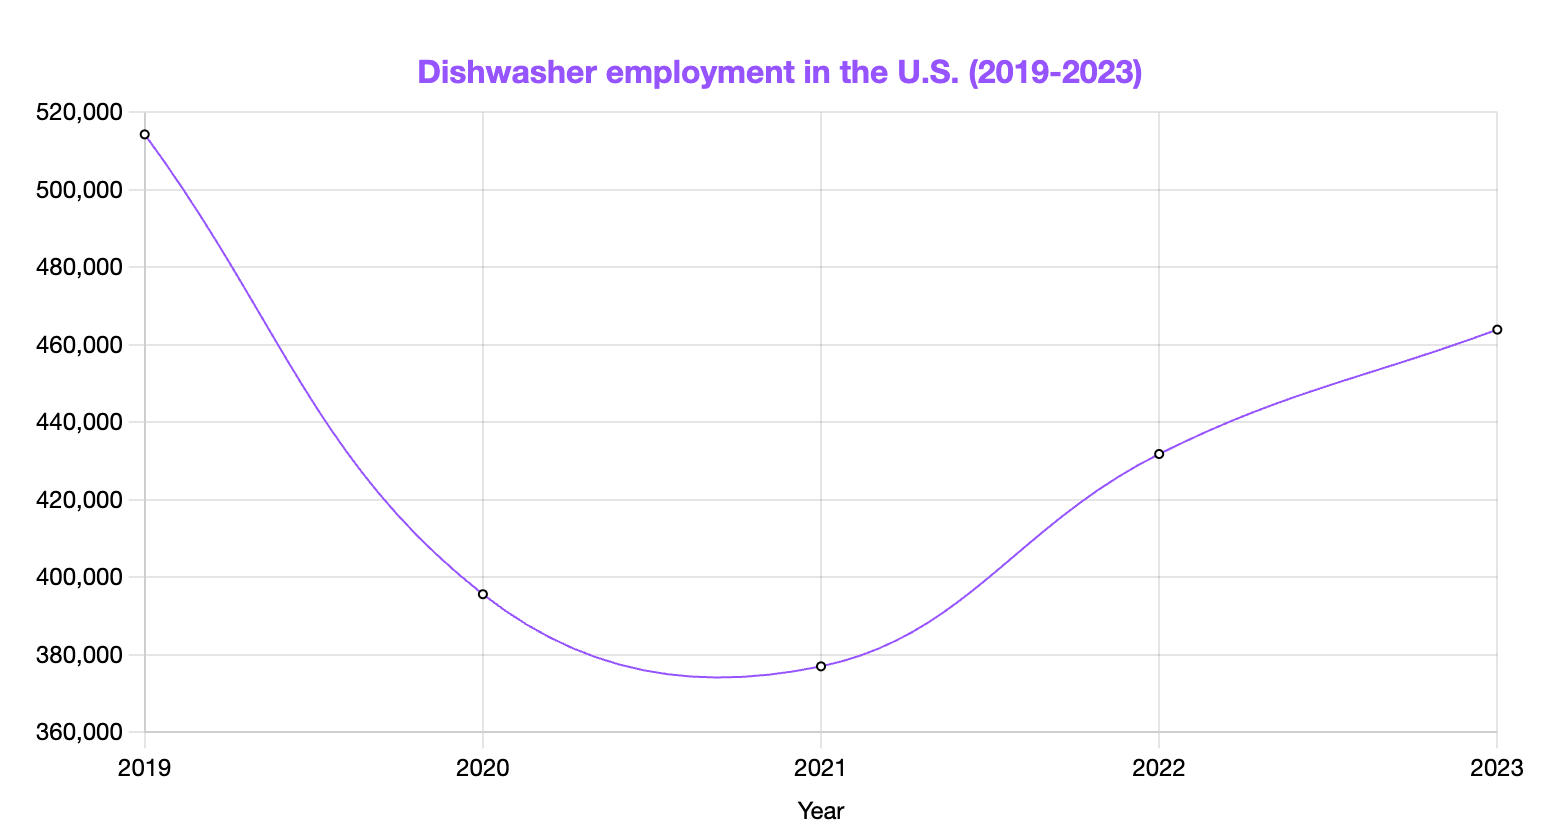
Similar to other hospitality careers, Dishwashers also saw a sharp decline during the 2020 pandemic. However, the industry is set to start growing in the near future.
Dishwasher Gender Statistics
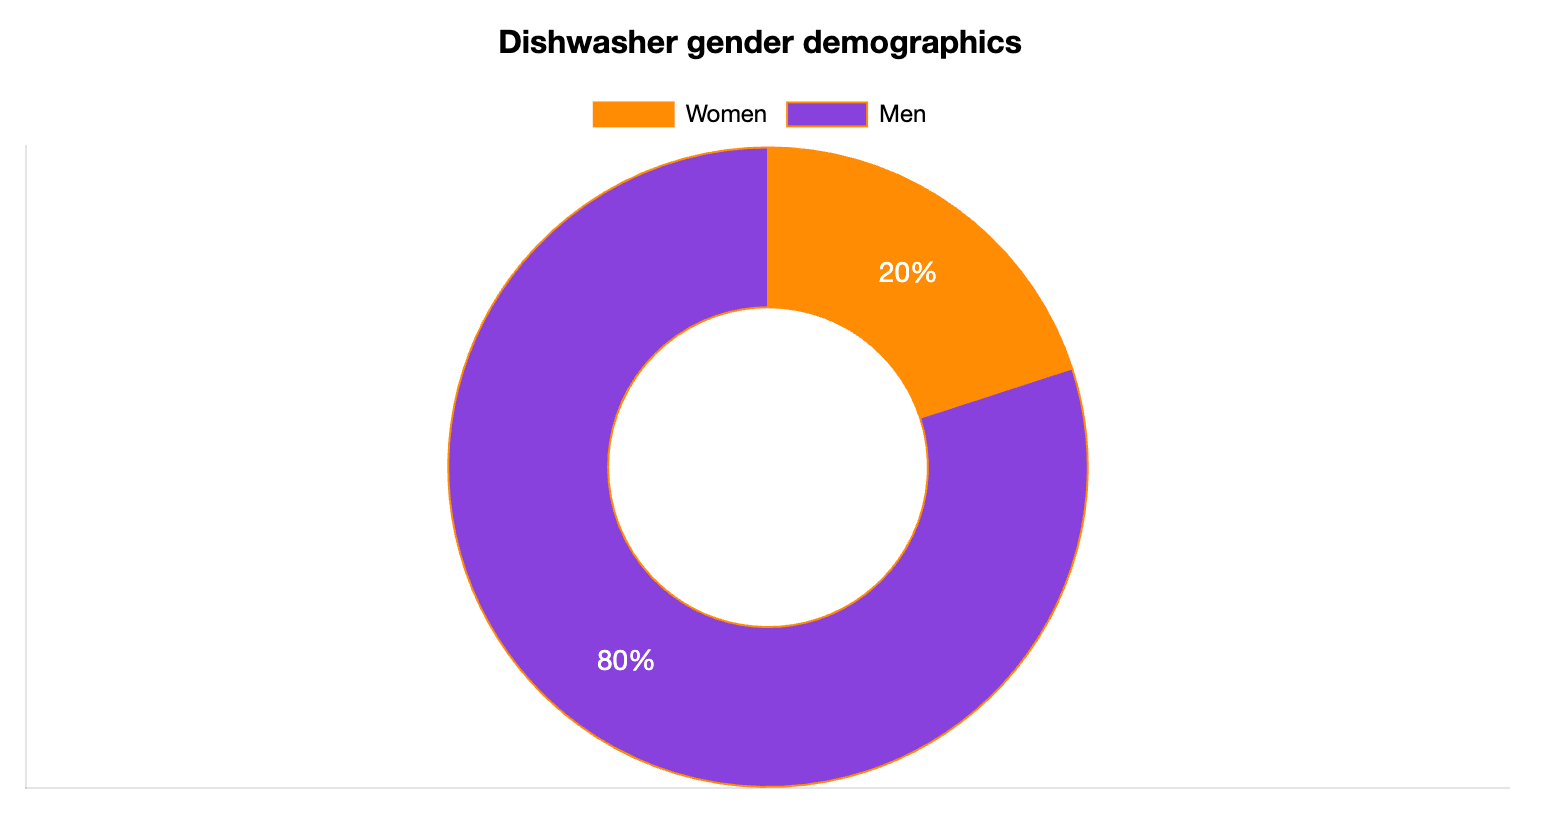
This is a male-dominated industry, with 80% of Dishwashers being men and only 20% women.
Another similar role is that of a Barback, as you can see on our Barback demographics page.
Dishwasher Age Statistics
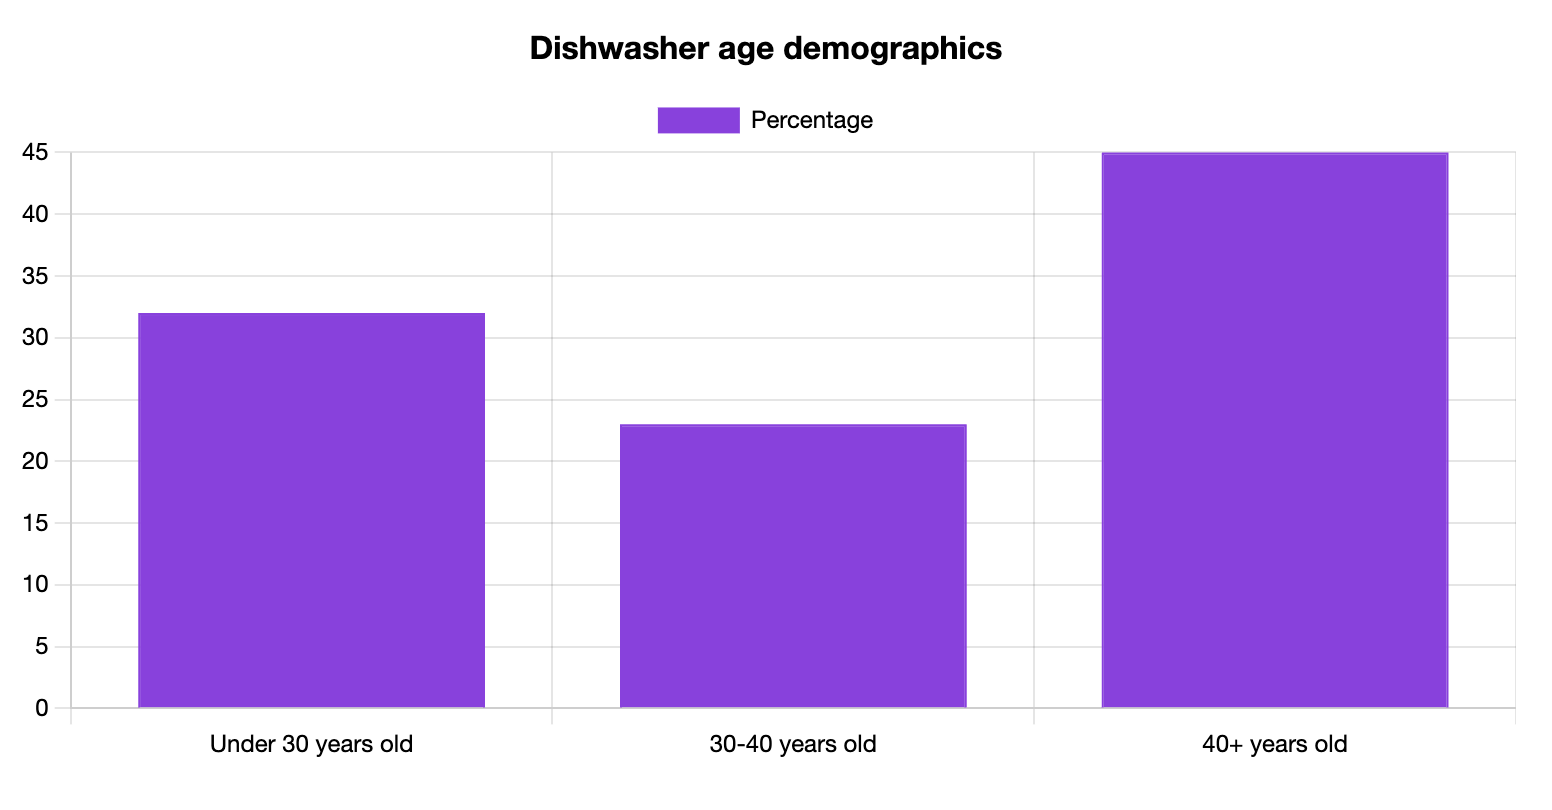
It seems that Dishwashers appreciate job stability and consistent working hours, which is most probably why a vast majority (45%) of them are over 40 years old.
Dishwasher Ethnicity and Race Statistics
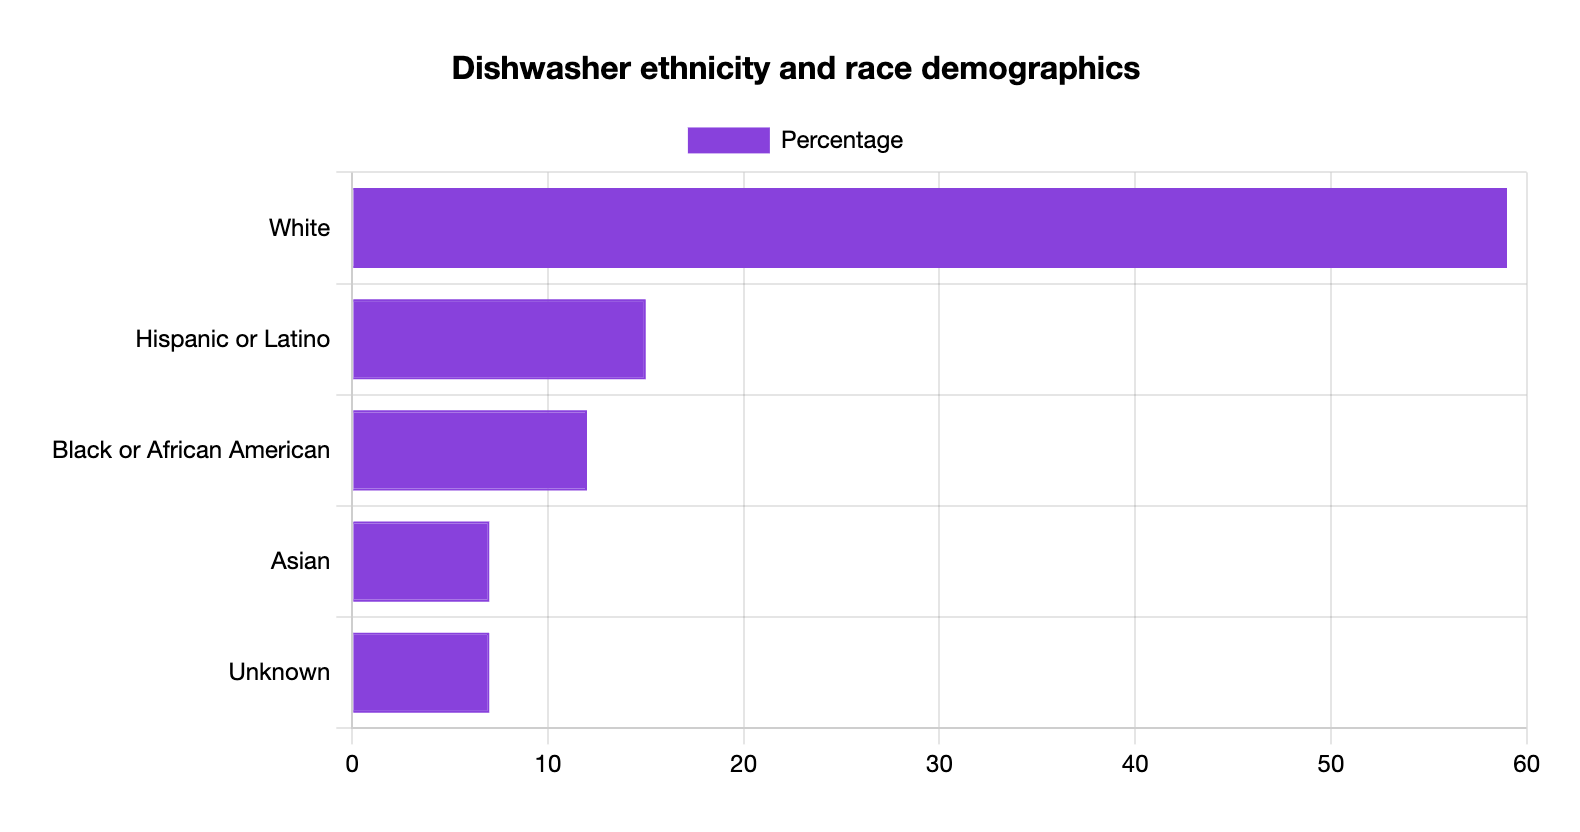
A substantial majority of Dishwashers are white (59%) and only 6% are Asian or have Asian roots.
This breakdown according to ethnicity and race is similar across hospitality positions, as you can see on our Busser demographics.
Dishwasher Education Statistics
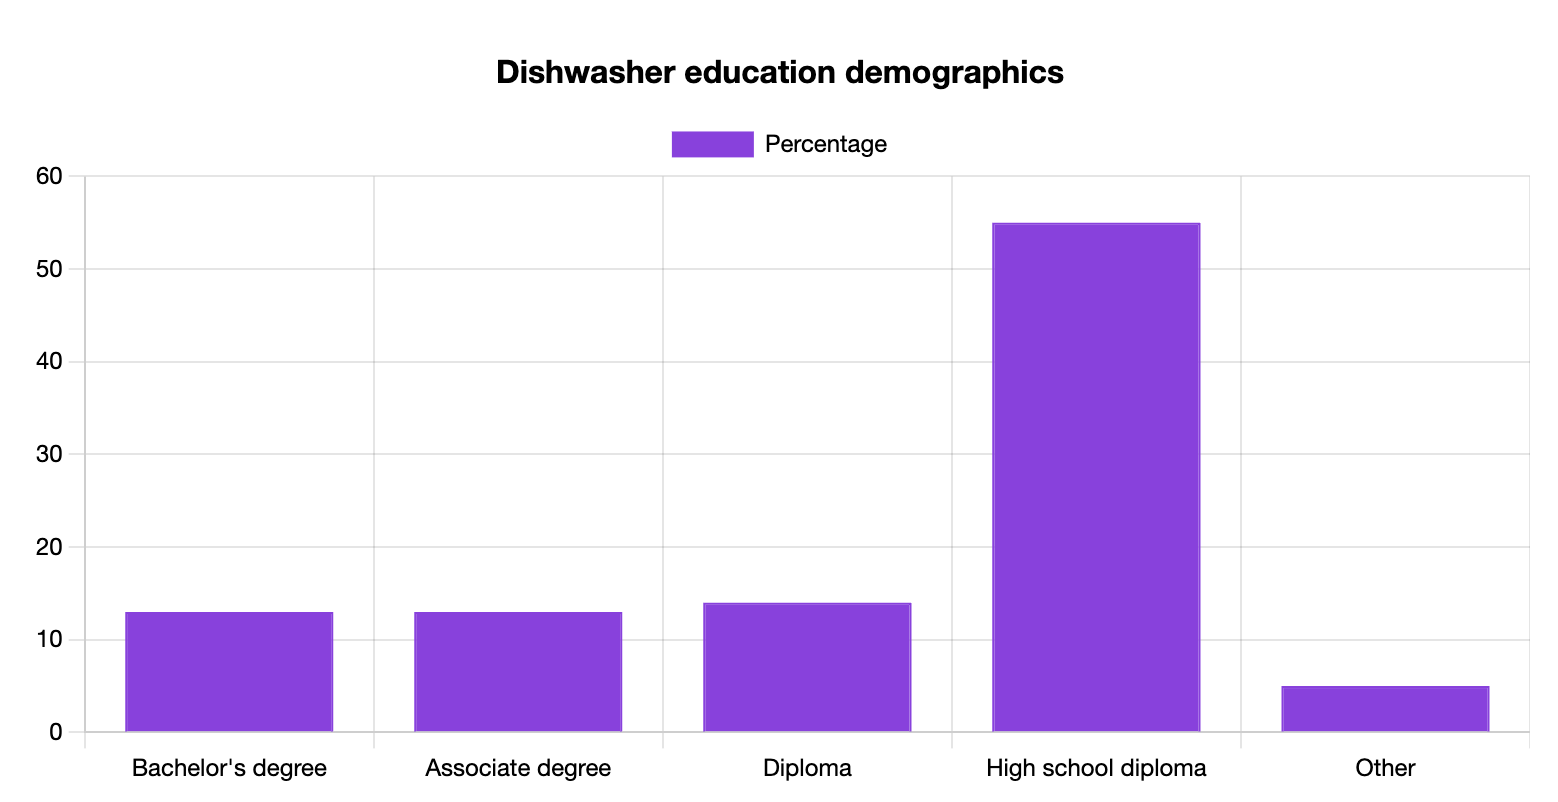
As an entry-level job with a low entrance barrier, it doesn’t come as a surprise that 55% of Dishwashers have a high school diploma and don’t tend to pursue further education.
Another role that doesn't have a high entrance barrier is that of Cashiers. Explore the breakdown of Cashier education demographics.
Dishwasher Tenure Statistics
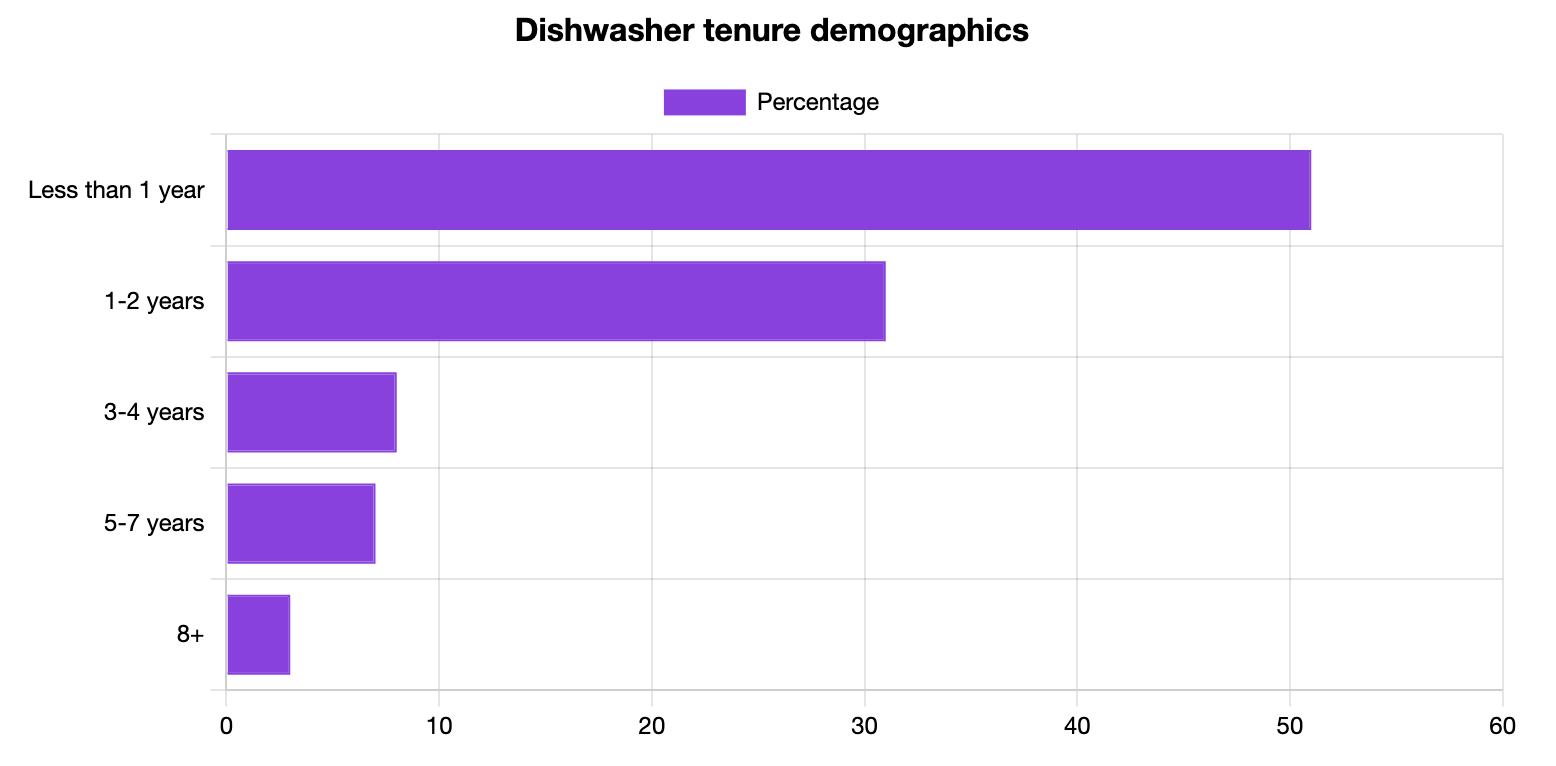
51% of Dishwashers quit their job during the first year. Physical demands and fairly limited career growth might be the main contributing factors to this trend.
Dishwasher Jobs by Industry
Dishwashers are predominantly hired in restaurants and healthcare and catering facilities.
Dishwasher Jobs by Company Size Statistics
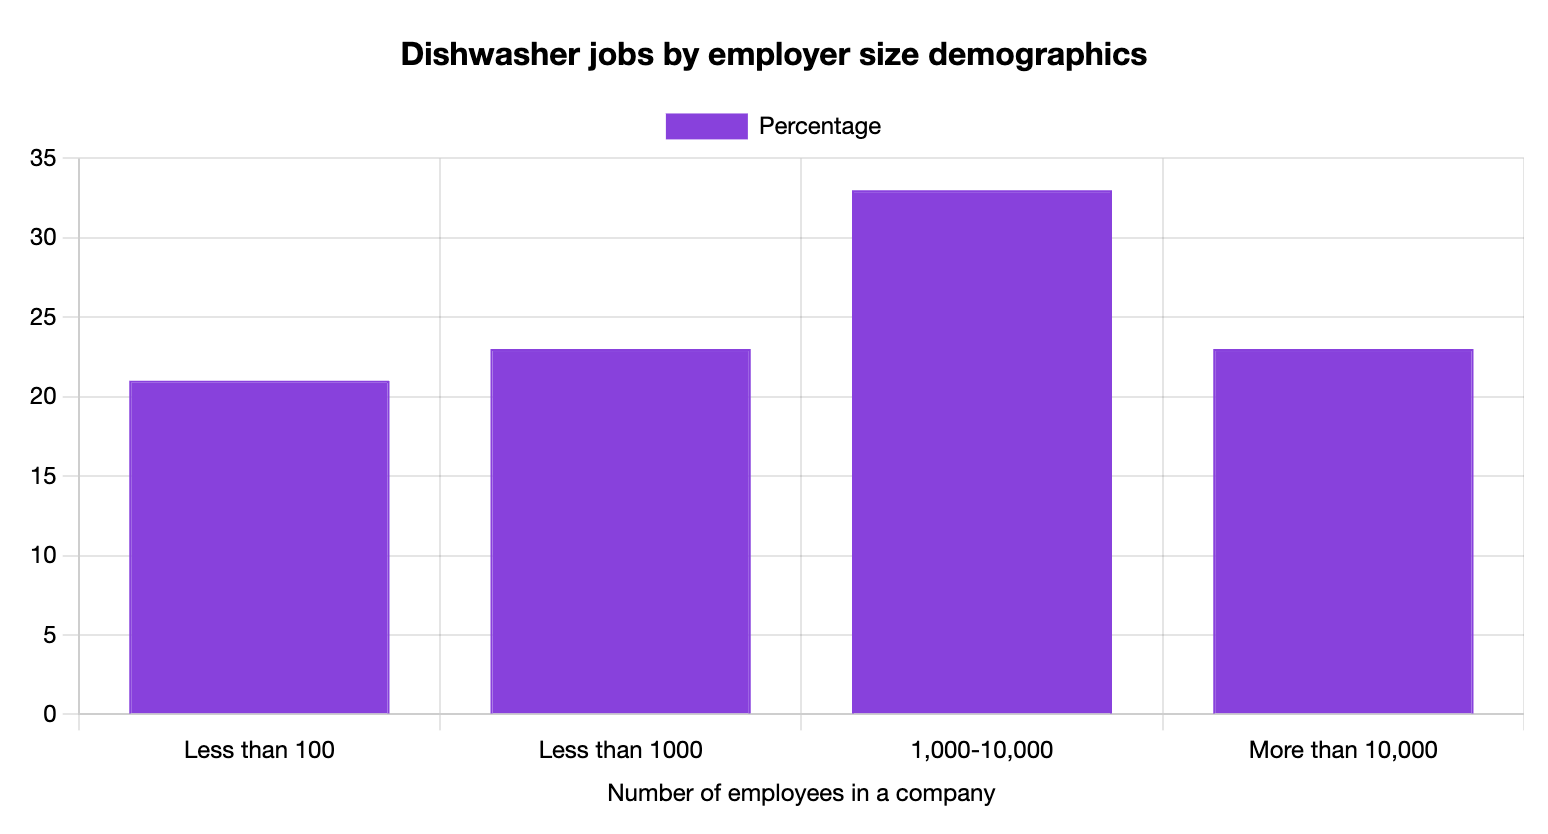
33% of the Dishwashing workforce is hired by medium-sized companies that have between 1,000 and 10,000 employees.
Dishwasher Languages Spoken
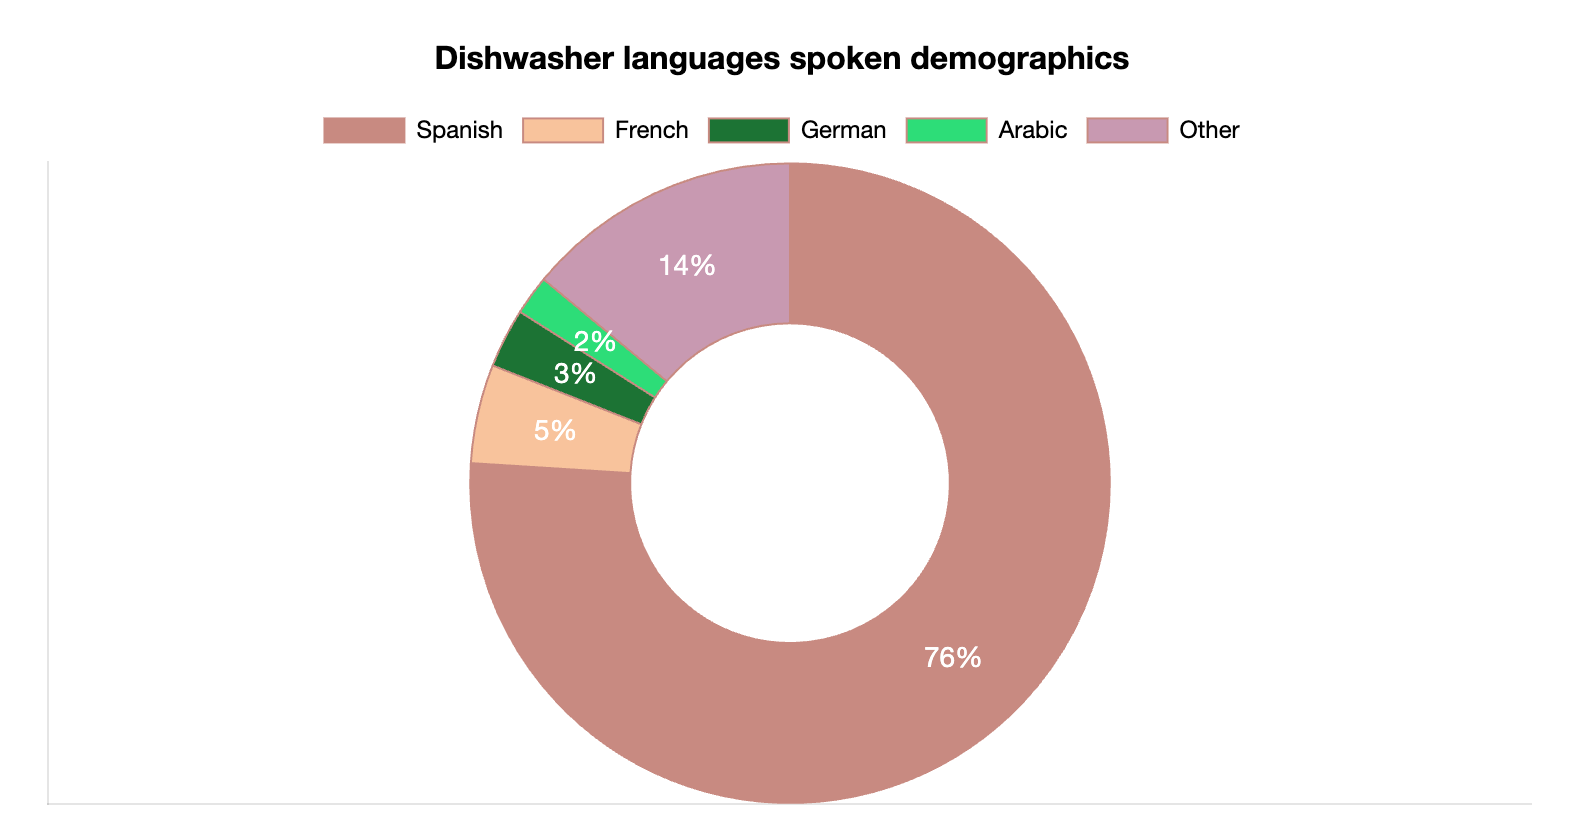
76% of Dish Cleaners who can speak a second language are fluent in Spanish, followed by a minority who can speak French (5%) and German (3%) as an additional language.
5 More Dishwasher Stats
- It is estimated that in the next decade, the Dishwasher job market will fall by 2%
- The average pay of $31,650 per year is equal for both men and women
- A dishwasher’s average salary is 51% below the total national average in the U.S.
- 70% of the workers are of Hispanic origin, with the majority of Dishwashers coming from countries like Mexico, Puerto Rico and Guatemala
- Dishwashers can earn up to $20 in tips daily
Dishwasher Statistics and Demographics Data
We’ve developed a special data analysis method that we use to ensure the information we provide is always on point and up-to-date. You can visit our webpage to read more about OysterLink’s demographics and statistics methodology.

