20 Must-Know Statistics & Employment Data for 2026
Whether you’re considering becoming a Cashier or you’re just curious about the industry trends, we’ve got some interesting statistics and demographics to provide you with deeper insight into the role of a Cashier.
- The Cashier workforce experienced an average decline of 7.22% between 2014 and 2022, driven by technological advancements like self-checkout kiosks and the rise of ecommerce.
- The future for Cashier roles looks uncertain, with projections showing a 10% decline in job openings due to the growth of automation in retail and food industries, like self-checkout systems.
- The median Cashier wage in the country is $2,559 a month
- Cashiers in Mississippi earn an average salary of $23,430 per year, which is about 31% below the national average wage for Cashiers, reflecting regional differences in salary and employment.
- Among 21% of Hispanic Cashiers, most workers come from Mexico (77%), Puerto Rico and El Salvador
Cashier Employment Statistics
Due to advances in technology, such as self-checkout stands and an increase in online sales, Cashier job postings in the U.S. are expected to continue declining.
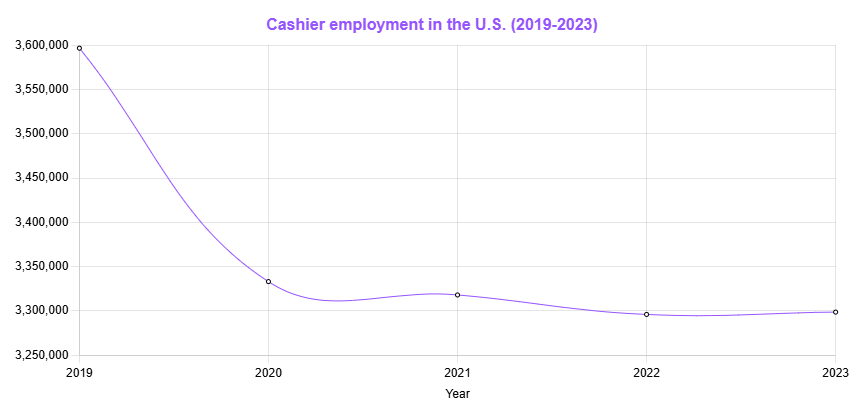
Alongside secretaries and administrative assistants, Cashiers are one of the fastest-shrinking job positions in the country. In the next decade, it is expected that there will be a reduction in over 355,000 Cashier job positions in the U.S. market.
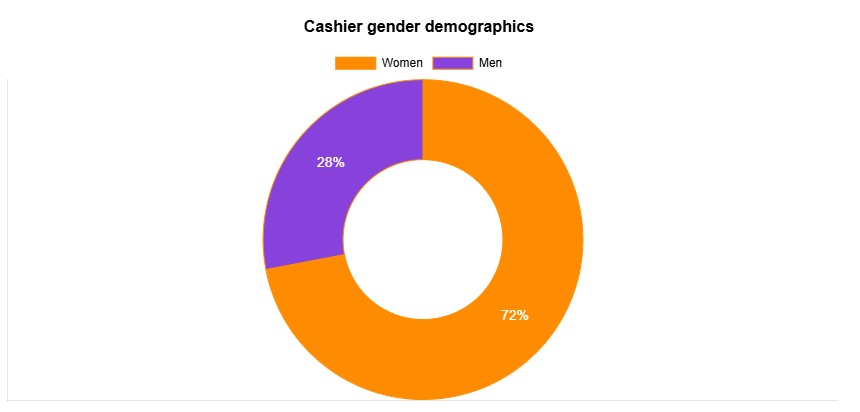
Gender Breakdown and Statistics for Cashiers
Traditionally, being a Cashier involves providing customer service, which has been culturally associated more with women than with men. As a result, there’s an overwhelmingly large number of women Cashiers (72%) in the industry.
The higher number of women in the role is similar to the Bartender demographics in the U.S., where there are more female than male individuals.
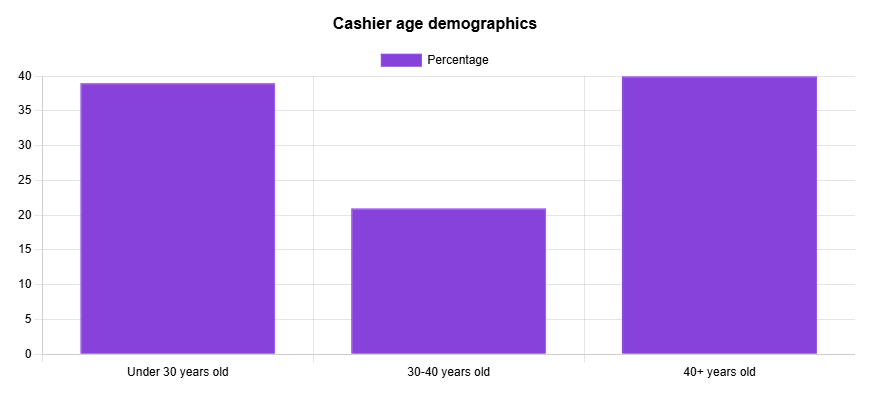
Cashier Age Statistics
The majority of Cashiers who work in retail, grocery and hospitality are over 40 years old (40%). This is similar to Busser demographics, where most individuals are older than 40.
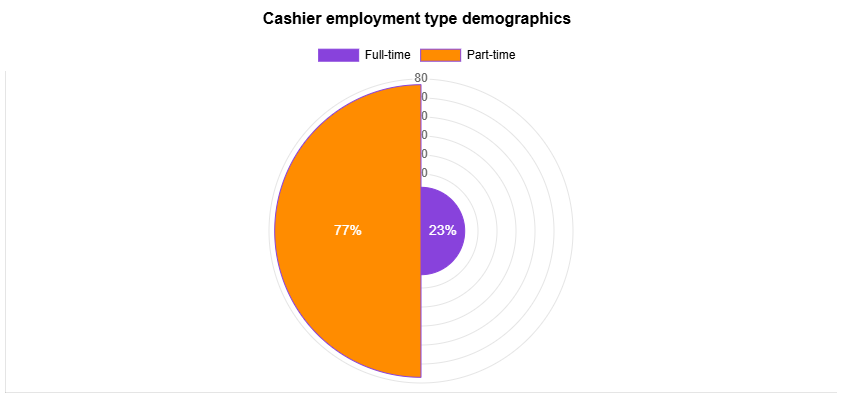
Cashier Employment Type Statistics
Due to the flexible nature of the job, 77% of Cashiers work part-time.
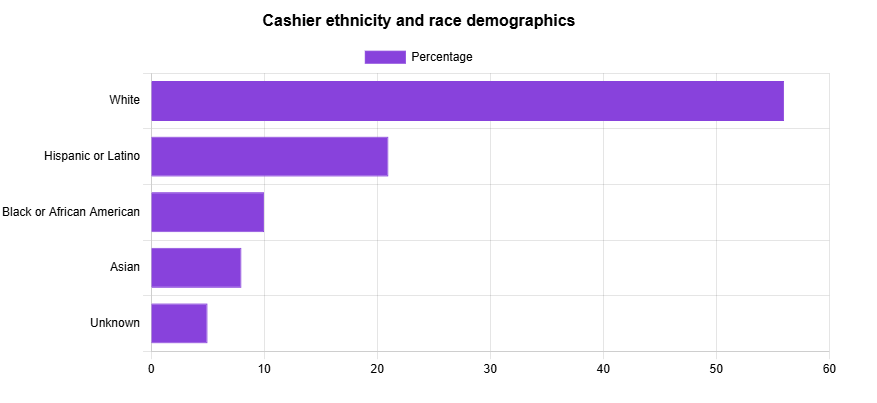
Cashier Ethnicity and Race Statistics
The majority of Cashiers (56%) in the U.S. are white, with smaller percentages representing other races.
Such a breakdown based on ethnicity is similar in other hospitality roles, as you can see on our Dishwasher demographics page.
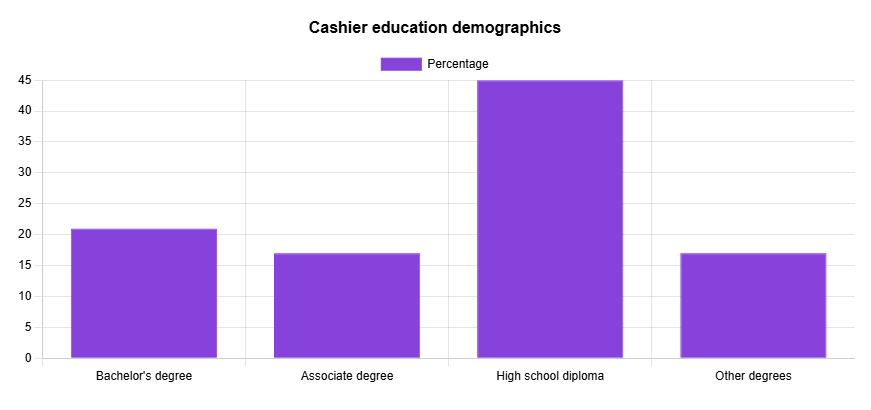
Cashier Education Statistics
Given this is an entry-level role that’s accessible to many in the workforce, 45% of Cashiers don’t pursue university education and work with just a high-school diploma.
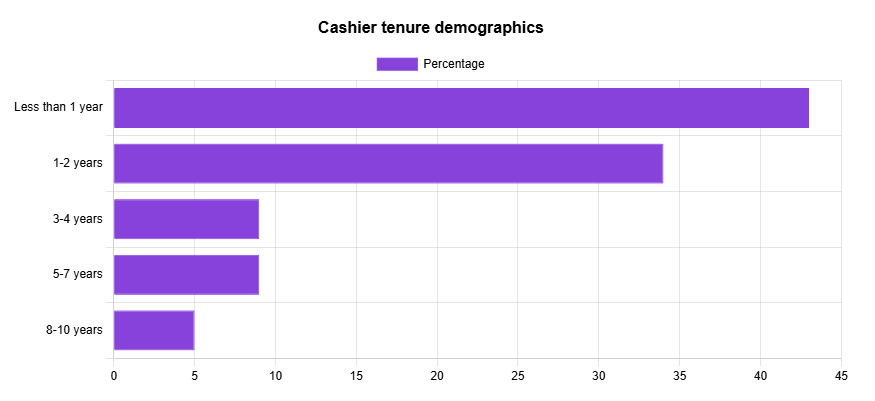
Cashier Tenure Statistics
Typically, this job is considered to be temporary or transitional for most employees. However, to make matters worse, Cashiers are leaving their jobs in record numbers, contributing to the high turnover rate.
Cashier Jobs by Industry
Most Cashiers work in food and beverage outlets (840,920), followed by gas stations (610,070).
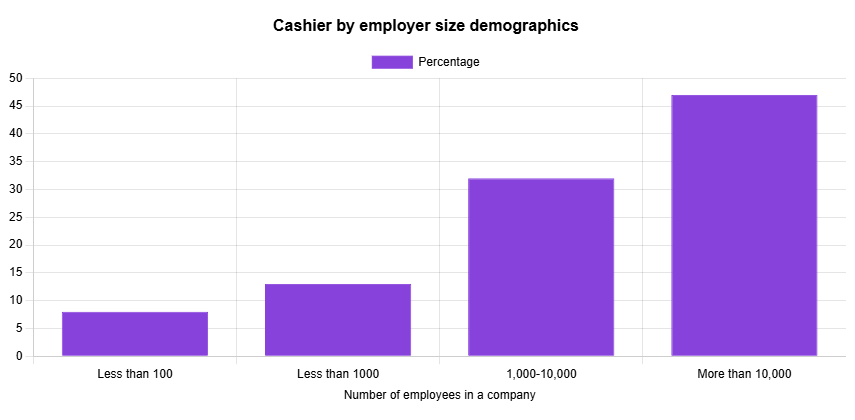
Cashier Jobs by Company Size Statistics
Most Cashiers (47%) work in large companies that employ over 10,000 workers.
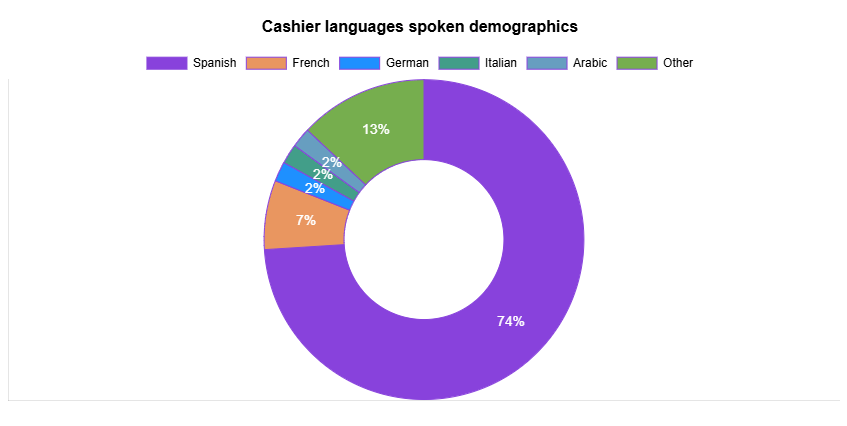
Cashier Languages Spoken
Considering that Latinos make up about 20% of the population in the U.S., Spanish remains one of the most widely spoken second languages (74%) alongside English.
4 More Cashier Stats
- The most common college diploma among Cashiers is Business Management (56,246 people)
- Despite the negative trend, the U.S. government projects to have 577,600 Cashier job openings yearly
- Cashiers contribute to a high turnover in retail, with an estimated 60% of workers quitting or losing their jobs during the pandemic in 2020
- Even though this is a female-dominated sector, women make $728 less yearly in comparison to men
Cashier Statistics and Demographics Data
To find out more about Oysterlink’s newly developed method we’ve used to gather the data in this article, check out our demographics and statistics page.

Written by Vukasin Petrovic
Vukasin is an experienced content creator with more than five years of writing and editing experience. With a background in English and an MFA in Creative Writing, he excels in digital marketing and copywriting, crafting narratives that engage the audience.

Reviewed by Stefan Petrov
With over 10 years of experience as a writer and editor, Stefan has worked in the automotive, IT, health and hospitality industries. Familiar with Google Search Console and other SEO tools like Ahrefs and Semrush, Stefan uses his experience to create content that's visually appealing to the user but also ranks in the SERPs.