Water and energy usage statistics in restaurants shine a light on the industry’s biggest hidden costs.
In the sections below, we’ll cover the data and the savings potential from smarter practices.
Water Usage Statistics in Restaurants
This section looks at how much water restaurants use daily and which functions — like kitchens, restrooms, and sanitation — consume the most.
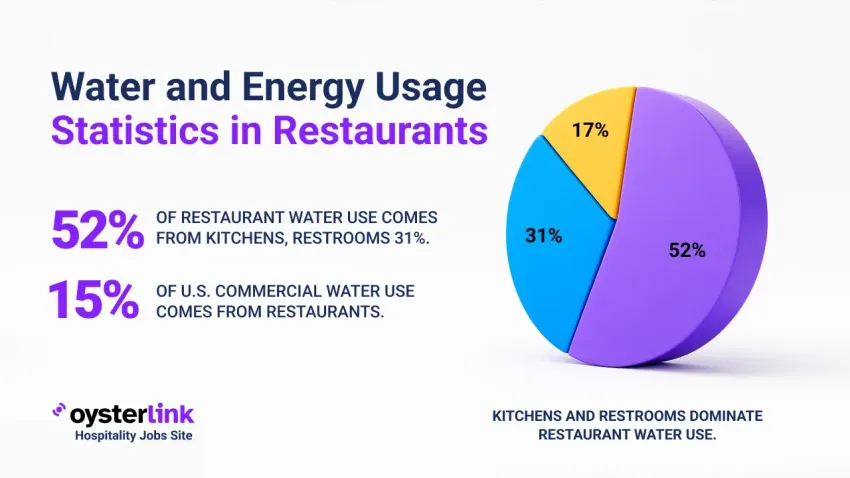
- Restaurants account for 15% of all water use in U.S. commercial and institutional buildings.
- In restaurants, kitchens account for 52% of water use, followed by restrooms at 31%.
- A typical U.S. restaurant uses about 5,800 gallons of water per day (≈2.1 million gallons/year, depending on size/operations.
- While EPA data shows the average U.S. restaurant uses about 5,800 gallons of water per day, smaller quick-service restaurants typically consume much less — around 936 gallons daily, with 40% used for drinks and ice, 34% for bathrooms and 26% for sanitation.

The Fastest Growing
Restaurant & Hospitality Job Platform
Looking for top paid jobs? Or Hiring for your business?
- The average national commercial water + sewer rate is $12.42 per 1,000 gallons.
- Water rates nationwide are increasing by an average of 6% per year.
Water Efficiency and Savings in Restaurants
Here we outline technologies and practices, from spray valves to ENERGY STAR equipment, all aimed at cutting water consumption and lowering operating costs.
- A faucet leak of one drip per second wastes over 3,000 gallons per year.
- Faucet aerators can cut restaurant water use by 30%–75% compared to standard faucets.
- Upgrading pre-rinse spray valves can reduce water use by 20%–40%; a Boston University case study reported a 63% reduction, saving 48,000 gallons annually.
- The payback period for replacing old pre-rinse spray valves can be as short as one month (from water + sewer cost savings).
- Older water-cooled ice machines can waste 130–180 gallons of cooling water per 100 pounds of ice, adding up to roughly 219,000 gallons annually at 400 lbs/day use.
- ENERGY STAR ice machines use 10% less water than conventional water-cooled units.
- ENERGY STAR dishwashers save 25% in both water and energy compared to standard machines.
- ENERGY STAR steam cookers use 3 gallons of water per hour, versus 40 gallons/hour for conventional models.
- High-efficiency and waterless urinals cut water use by 50%–100%.
- Dual-flush or 1.28 GPF toilets reduce water use by about 20% compared to older models.
- Drip irrigation systems for landscaping cut outdoor water use by 20%–50%.
- Composting food waste instead of using garbage disposals results in 100% water savings for that process.
- Operating costs in commercial facilities can drop by about 11% when water-efficient practices are used.
- Water and energy use can also fall by roughly 10–15% through these same measures.
The Fastest Growing
Restaurant & Hospitality Job Platform
Looking for top paid jobs? Or Hiring for your business?
Energy Usage Statistics in Restaurants
This section breaks down how foodservice buildings consume energy, which activities drive the highest demand and how restaurants compare with other commercial buildings.
- Foodservice buildings are about 4× more energy-intensive per square foot than the U.S. commercial average.
- Within foodservice buildings, cooking makes up about 40% of energy use, followed by refrigeration at 15% and space heating at 12%, with all other end uses at 7% or less.
- Cooking, refrigeration and lighting together account for 68% of restaurant energy costs.
- Energy typically represents 3%–5% of a restaurant’s total operating costs.
- Restaurants spend an average of $3.77 per square foot per year on electricity.
- Restaurants spend about $1.57 per square foot per year on natural gas.
- A typical restaurant’s monthly energy spend ranges from $2,000 to $6,000, depending on size and hours of operation.

- Reducing energy use by 20% is considered achievable without sacrificing service or quality.
- Smart use of kitchen equipment can cut energy consumption by 7%.
- Replacing incandescent exit signs with LED exit signs saves up to 80% in energy use.
- A 1°F thermostat adjustment for eight hours daily reduces annual energy consumption by about 1%.
Electricity Usage by Restaurant Type
Here we examine how different restaurant formats — fast food, full service, and coffee shops — vary in their electricity use and reliance on power for operations.
- The average foodservice building uses 43.8 kWh per square foot per year.
- With an average size of 4,800 sq ft, a typical restaurant consumes about 210,000 kWh annually, costing roughly $2,280 per month in electricity.
- Fast food restaurants use about 62.8 kWh per square foot per year, which equals roughly 257,480 kWh annually for a 4,100 sq ft site.
- Full-service restaurants and cafeterias use about 40.6 kWh per square foot per year, which equals roughly 215,180 kWh annually for a 5,300 sq ft site.
- Other foodservice types such as coffee shops and snack bars use about 29 kWh per square foot per year, which equals roughly 118,900 kWh annually for a 4,100 sq ft site.
- Electricity makes up about 82% of total energy use in fast food restaurants.
- Electricity accounts for about 52.6% of energy use in full-service and cafeteria operations.
- Electricity represents about 42.4% of energy use in smaller foodservice categories.
Industry Insights From OysterLink
OysterLink helps restaurant professionals make sense of water and energy consumption trends with data-driven insights that cut costs and improve efficiency.
In addition to industry statistics and sustainability strategies, OysterLink connects hospitality employers with top talent. Posting a job is simple and affordable — with over 350,000 monthly active users, it’s the easiest way to find skilled hospitality professionals.


Loading comments...