U.S. restaurant industry statistics 2026 highlight the scale of an industry that fuels jobs, local economies, and dining culture across America.
With sales projected in the trillions, find out which states dominate the landscape and what these numbers mean for operators and professionals planning ahead.
Restaurant Industry Overview: Size and Economic Impact
In 2026, the restaurant industry continues to be a vital component of the U.S. economy, contributing significantly to the GDP.
- The country’s restaurant and foodservice industry is projected to reach $1.5 trillion in sales this year, a 4% increase compared to 2024.
- This substantial figure underscores the industry's critical role as a driver of the U.S. economy, accounting for approximately 4% of GDP.
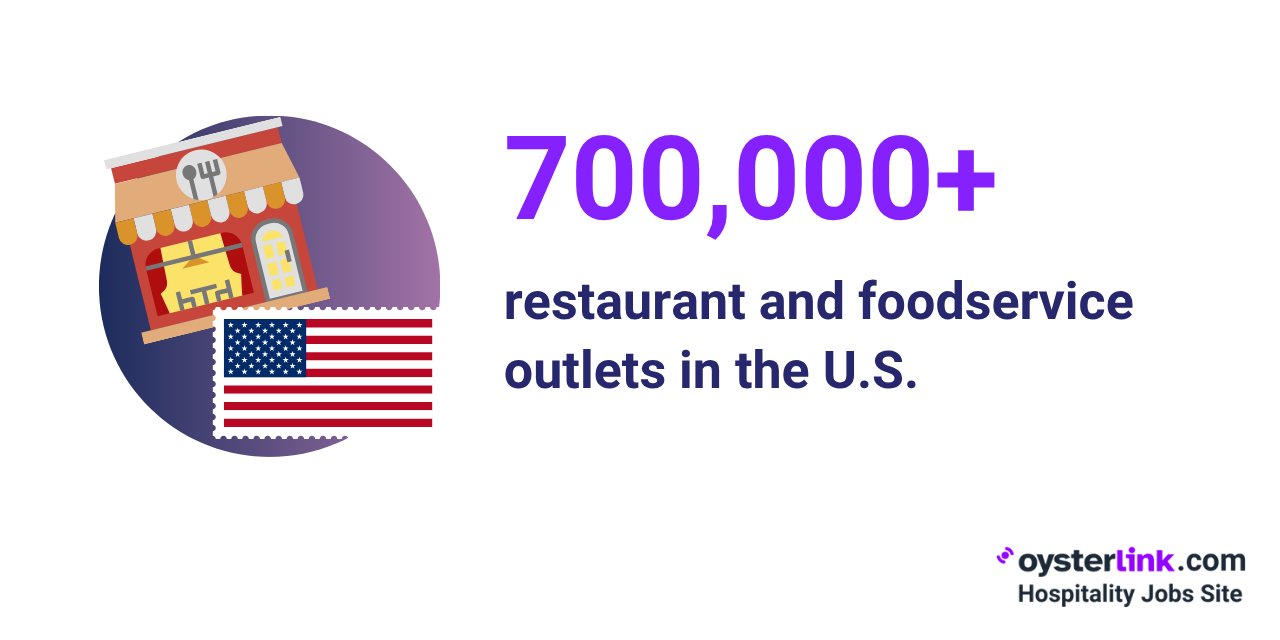
- There are currently 700,000+ restaurant and foodservice outlets in the U.S.

The Fastest Growing
Restaurant & Hospitality Job Platform
Looking for top paid jobs? Or Hiring for your business?
- Approximately 50,000 new restaurants open each year in the U.S.
- About 7 out of 10 restaurants in the U.S. operate as single-unit establishments, meaning, they’re not part of a chain.
- Recent data shows that there are 150,150 single-unit full-service restaurants cross the country.
- Fast-food or quick-service chains are the most common type of restaurant in the U.S., totaling more than 207,800 nationwide.
| Type of restaurant/foodservice outlet | Approximate number in the U.S. |
| Fast-food or quick-service chains | 207,800 |
| Single-location, full-service restaurants | 150,100 |
| Chain full-service restaurants | 137,500 |
| Coffee and snack shops | 83,000 |
| Bars and nightclubs | 67,800 |
| Food trucks | 58,000 |
| Pizza restaurants | 74,000 |
| Italian restaurants | 62,100 |
| Mexican restaurants | 50,000 |
| Chinese restaurants | 25,700 |
| Sushi restaurants | 16,900 |
US Restaurant Statistics on Revenue and Sales
The industry has shown remarkable resilience and growth, with sales figures reaching impressive heights.
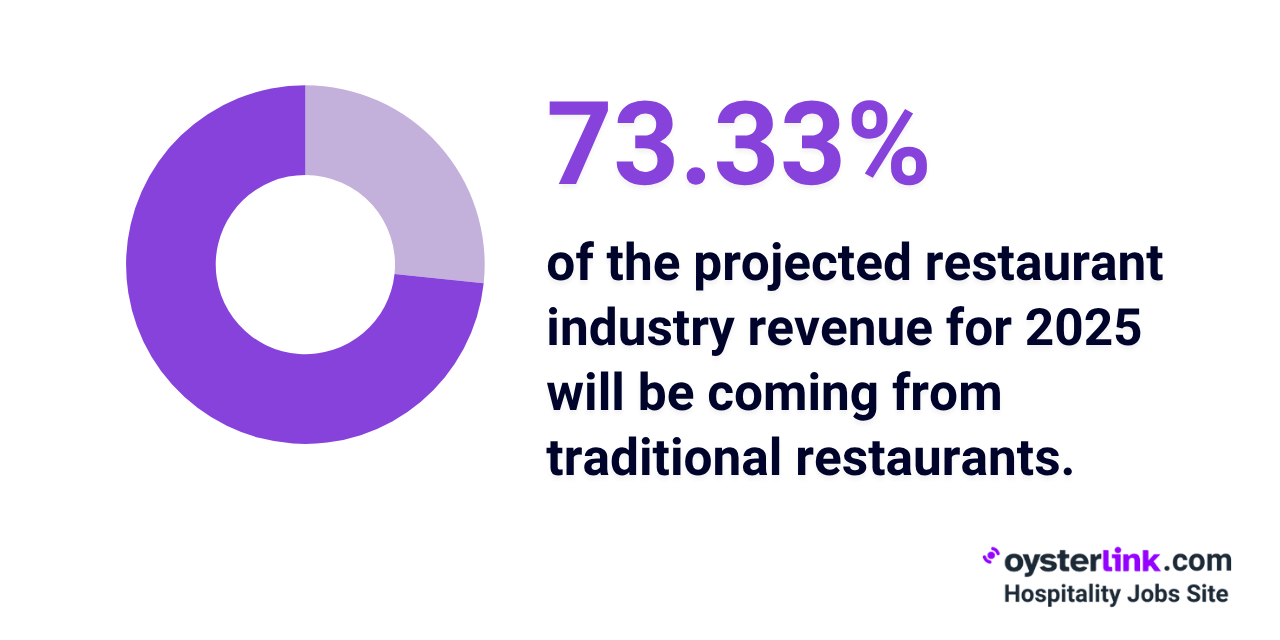
- Traditional restaurant sales are expected to surpass $1.1 trillion in 2026, marking a 4.1% year-over-year increase.
- That said, traditional restaurants make up the largest share (73.33%) of the total $1.5 trillion in projected U.S. restaurant sales.
- Several factors contribute to this growth, including technological innovations enhancing customer experiences.
- Rising menu prices, driven by increased food and operational costs, also play a role in the overall revenue growth.
- The average profit margin for full-service restaurants stands at about 9.8%.
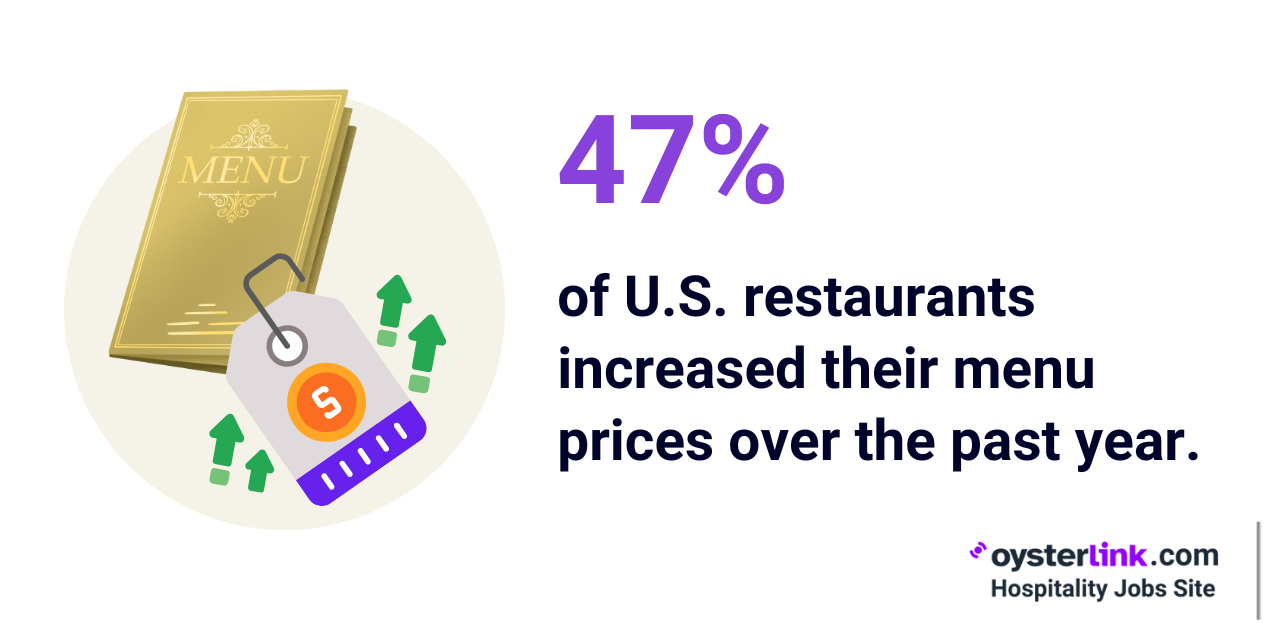
- Around 47% of restaurants in the U.S. increased their menu prices in 2024.
- Restaurant operators typically aim to keep food costs between 28% and 35% of their total revenue to ensure profitability.
- In April 2025, dining out cost 3.9% more than it did a year earlier.
Restaurant Segment-Wise Revenue: Statistical Overview
The U.S. restaurant industry in 2026 exhibits diverse performance across its various segments, reflecting consumer preferences and market dynamics.
Full-service restaurants
Full-service restaurants have experienced steady growth.
- As of 2025, the market size for single-location full-service restaurants is approximately $253.9 billion, with an annual growth rate of 9.2%.
Fast-food and quick-service restaurants (QSRs)
- The fast-food and QSR market is expected to grow from $311.54 billion in 2024 to $330.56 billion in 2026.
- By 2029, the market is forecasted to grow to $436.07 billion.
This growth is fueled by the rise of digital ordering, convenience and consumers' demand for fast, accessible dining options.
Fast-casual restaurants
- The U.S. fast-casual market is projected to grow significantly, adding approximately $84.5 billion in revenue between 2025 and 2029.
This accelerated growth is largely driven by increased consumer demand for convenience combined with quality and menu innovation.
The Fastest Growing
Restaurant & Hospitality Job Platform
Looking for top paid jobs? Or Hiring for your business?
Bars and nightclubs
- Revenue for bars and nightclubs in the U.S. will reach approximately $38 billion, marking a 2.5% increase over the previous year.
Restaurant Employment and Workforce Statistics
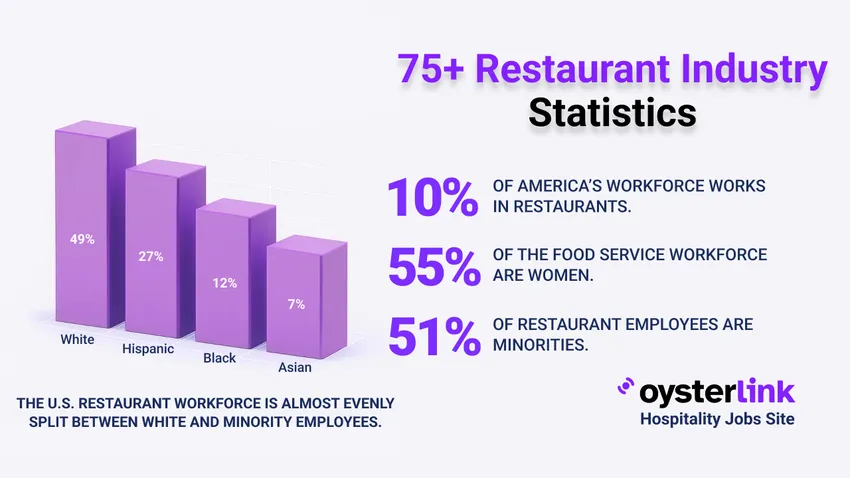
- The U.S. restaurant and foodservice industry is the second-largest source of private employment in the U.S., currently supporting 15.7 million workers (roughly 10% of the country’s total workforce).
- This includes 12.5 million jobs at eating and drinking places, plus an estimated 3.2 million foodservice jobs in other sectors such as healthcare, accommodations and arts, entertainment and recreation.
- By the end of 2026, the U.S. restaurant industry is expected to employ 15.9 million people.
- This includes the addition of around 200,000 new jobs within the year.
- From a longer-term perspective, the industry is projected to employ 17+ million people by 2030.
- Women represent 54.7% of the foodservice workforce, which is higher than the 48% of women in the total U.S. labor force.
- Meanwhile, while men make up 45.3% of the restaurant and foodservice industry and 52.4% of the national labor force.
- 50% of Restaurant Managers and other supervisors are women, making this sector the nation’s leading employer of female managers.
- Tipped front-of-house roles are also female-dominated, with women holding 69% of Server positions and 61% of Bartender roles.
- Meanwhile, male employees make up a majority of back-of-house positions. 79.3% of Chefs and 64.4% of Cooks are men.
- Around 51% of restaurant employees are minorities, compared to 41% across the overall U.S. labor force.
- Hispanic workers account for 27% of restaurant employees, while 12% are Black or African American and 7% are Asian.
- The restaurant industry employs more young workers compared to the overall U.S. workforce.
- Employees aged 16 to 24 represent 40% of the restaurant workforce.
- Meanwhile, 60% of restaurant workers are under 35, a significantly higher percentage compared to the 35% across all industries.
The Fastest Growing
Restaurant & Hospitality Job Platform
Looking for top paid jobs? Or Hiring for your business?
- Educational attainment in this industry also tends to be lower, partly because many workers are still in school.
- About 34.5% of restaurant employees have only a high school diploma, while 24.4% have some college but no degree yet.
- One in three Americans gets their first job experience in a restaurant, making it a common entry point into the workforce.
- Moreover, 63% of adult-age Americans have worked in restaurants at some point in their lives.
- More than 9 in 10 restaurants operate with fewer than 50 employees, highlighting the industry's reliance on small teams.
- 51% of restaurant operators consider staffing as their main challenge, while 35% say that it’s training staff.
- Recent data shows that annual restaurant staff turnover hovers near 80%. This staffing instability directly impacts operational efficiency.
- It costs restaurant operators roughly $5,864 per most replacement, including both hiring and training a new staff member.
- Meanwhile, the average cost for hiring and training a new Restaurant Manager is approximately $15,000.
- The average restaurant employee tenure is around 110 days.
Consumer Spending and Behavior Trends
- As of January 2025, U.S. restaurant sales reached $98.6 billion, marking a 5.4% increase from the previous year.
- However, after adjusting for rising menu prices, the real growth in restaurant spending was 2%.
- This indicates that while consumers are spending more, a portion of this increase is attributed to inflation.
- Approximately 75% of restaurant orders come from drive-thru, takeout or pickup options rather than in-person dining.
- 51% of diners turn to restaurant apps to find deals and discounts that could offset their expenses.
- Recent government data predicts a 4% increase in prices for food-from-home (e.g., restaurant meals).
- 60% of consumers in the U.S. get their food via delivery or takeout at least once a week.
- 74% of diners use social media to decide where to eat, while 68% check a restaurant’s social media account before visiting.
- 22 % of customers return because of a restaurant’s social media presence.
- 78% of consumers view restaurants with strong social media presence to be more likely to succeed.
Statistics About Restaurant Technology Investment
From AI and automation to self-service kiosks and smart kitchen devices, tech upgrades are reshaping how restaurants are being run.
The Fastest Growing
Restaurant & Hospitality Job Platform
Looking for top paid jobs? Or Hiring for your business?
- Most operators (73%) increased their spending on restaurant technology last year.
- Top tech investment priority for operators is digital and location-based marketing (63%).
- 53% of restaurants now use AI to predict sales, while 33% use it for personalized recommendations
- 35% of restaurant owners said adopting new technology helped them cut costs, while 77% reported it reduced stress on their staff.
- 63% of operators are planning to adopt automation and robotics for food preparation.
- 67% of restaurateurs are incorporating IoT technology into their kitchens, including smart ovens, fridges and dishwashers.
- IoT devices cut energy costs by optimizing appliance use, with some restaurants seeing a 15-20% reduction in utility bills.
- Approximately 70% of consumers prefer self-service kiosks, mainly due to speed and customization options.
- Restaurants have seen an average


Loading comments...