Economic Indicators for the Restaurant Industry: Key Insights
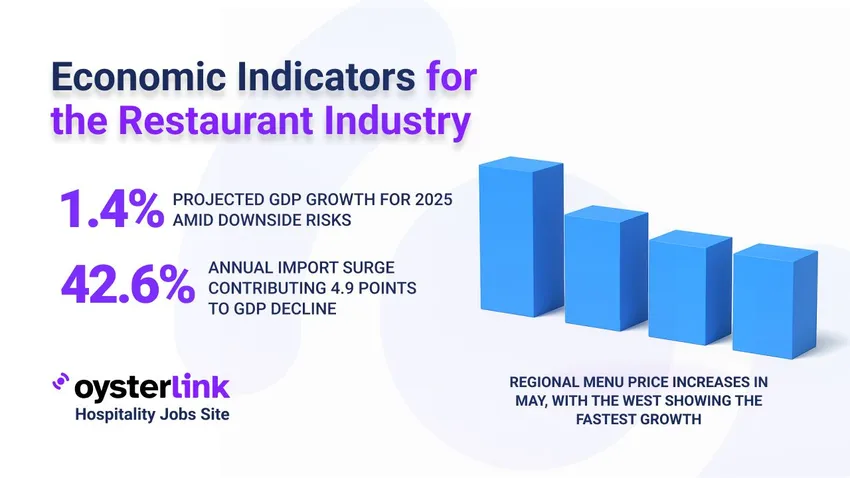
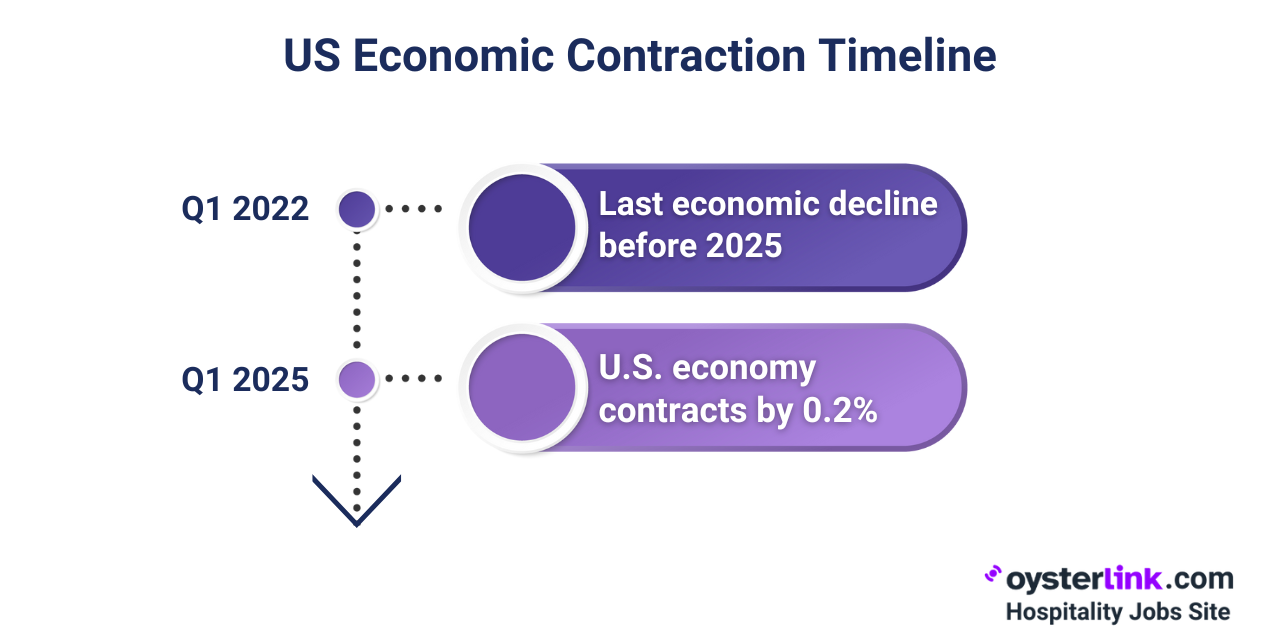
- United States GDP contracted by 0.2% in Q1 2025, the first decline since Q1 2022.
- Imports surged 42.6% annually, contributing 4.90 percentage points to the GDP decline.
- Forecasted GDP growth for 2025 is 1.4% but with significant downside risks.
- The Restaurant Performance Index (RPI) increased by 0.9% in April, rising from 98.9 to 99.7, signaling modest industry growth.
Is the restaurant industry in the clear, or are there still some economic storm clouds on the horizon?
A look at the economic indicators for the restaurant industry in 2025 paints an interesting, if somewhat confusing, picture.
Sales dipped in May, but employment is up, and menu prices are still climbing.
Let's dive into the key statistics to see what's really going on.
Q1 2025 GDP Contraction: A Broader Economic Context
The U.S. economy experienced a contraction of 0.2% in the first quarter of 2025, marking the first decline since Q1 2022. This downturn was influenced by several factors, including a surge in imports.

The Fastest Growing
Restaurant & Hospitality Job Platform
Looking for top paid jobs? Or Hiring for your business?
Slowing Consumer Spending: Implications for Restaurants
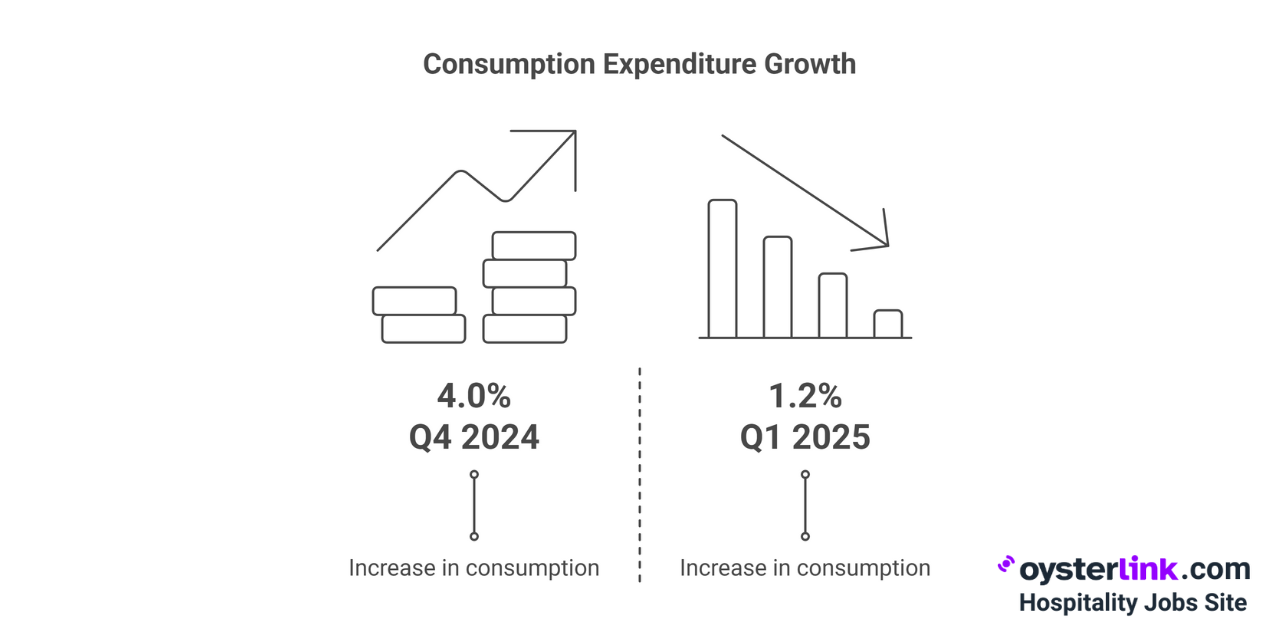
More directly relevant to the restaurant industry, personal consumption expenditures slowed considerably, rising only 1.2% in Q1 2025.
This was a considerable drop from the 4.0% increase in Q4 2024 and represented the slowest pace in nearly two years.
Restaurant Sales Decline in May: A Temporary Setback?
In May 2025, total sales at eating and drinking places reached $97.4 billion (seasonally adjusted), a 0.9% decrease from the downward-revised $98.3 billion in April.
This decline represents the first drop in restaurant sales in three months and the largest monthly decrease in over two years.
Year-Over-Year Growth: A Positive Long-Term Trend
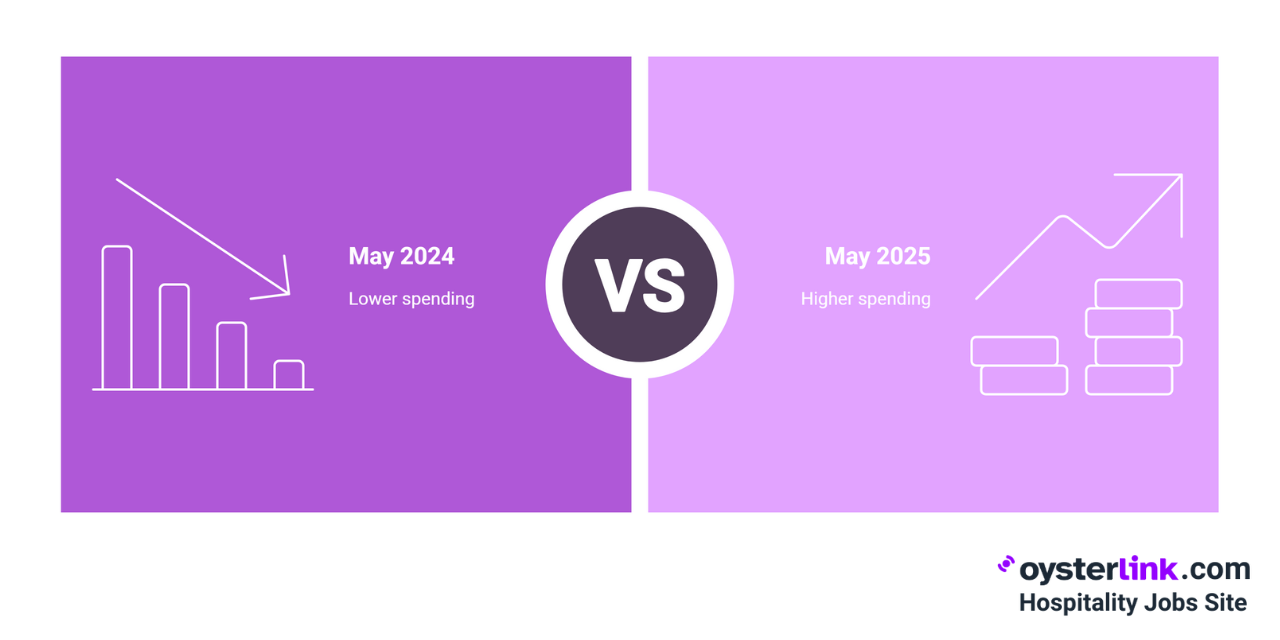
Despite the monthly decline, consumer spending at restaurants was 5.3% higher in May 2025 than in May 2024.
This marks the third consecutive month with year-over-year gains exceeding 5%, indicating the overall trendline remains generally positive.
Although consumers have decreased spending, the overall spending compared to last year (2024) is up.
Inflation-Adjusted Sales Growth in the Restaurant Industry
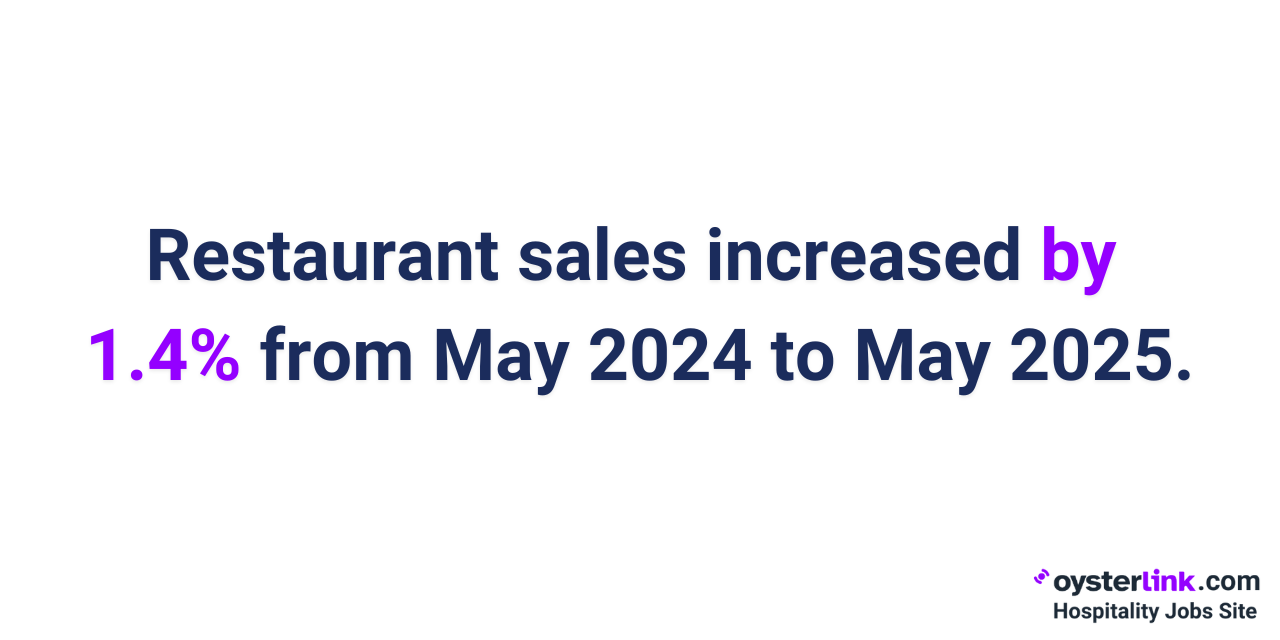
Recent months have also witnessed modest growth on an inflation-adjusted basis. After adjusting for menu price inflation, eating and drinking place sales were up 1.4% between May 2024 and May 2025.
The Inflationary Environment: Menu Prices and Consumer Costs
Menu prices continued their upward trend in May, rising by 0.3% and marking the fourth consecutive month of gains. This upward trend in menu prices is happening while overall inflation has cooled down.
There are notable regional variations in menu price growth.
The West experienced the fastest menu price growth in May, with a 4.4% year-over-year increase.
Other regions saw more modest and closely aligned gains, with menu prices up 3.7% in the Northeast and 3.6% in both the Midwest and the South.
The Restaurant Performance Index (RPI): Gauging Industry Health
The Restaurant Performance Index (RPI) is a monthly composite measure that tracks the overall health of the U.S. restaurant industry.
In April 2025, the RPI increased by 0.9%, rising from 98.9 in March to 99.7.
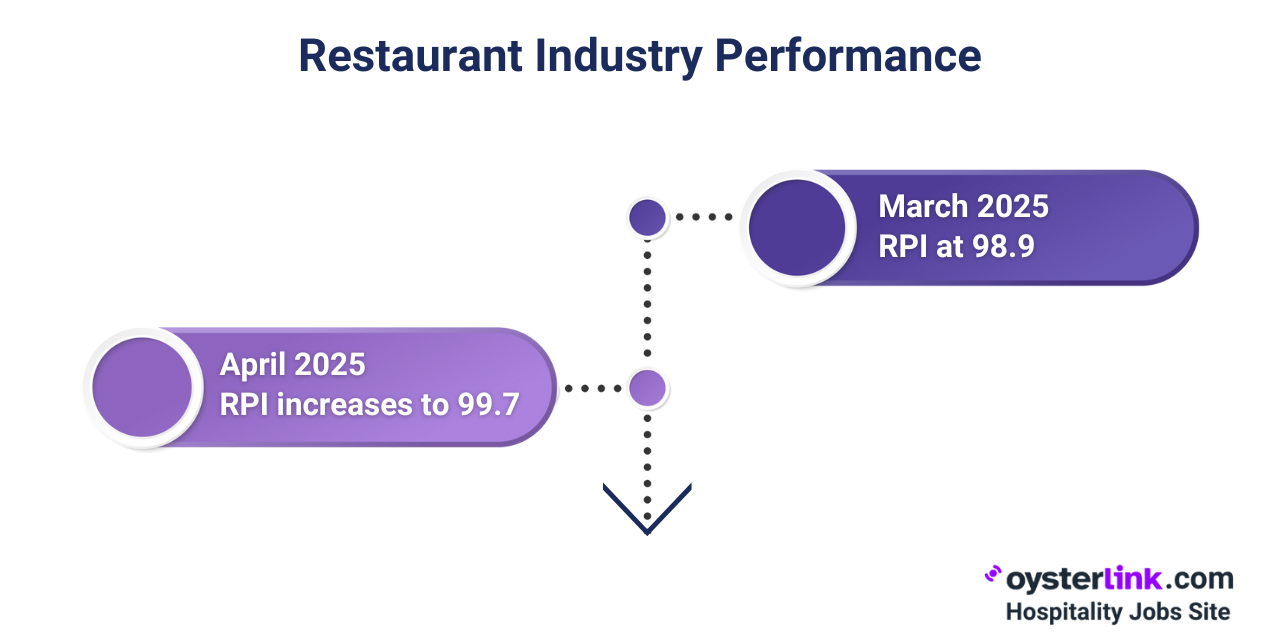
While still below the neutral level of 100, this increase indicates a modest improvement in industry conditions. The RPI is based on a survey of restaurant operators nationwide.
The Fastest Growing
Restaurant & Hospitality Job Platform
Looking for top paid jobs? Or Hiring for your business?
Full-Service vs. Limited-Service Restaurant Price Trends
On a year-over-year basis, full-service menu prices were up 4.2% in May 2025, a slight pullback from April's 4.3% rate. Limited-service prices increased by 3.5% over the past year.
While both segments continue to see elevated inflation, the pace of growth has moderated significantly from recent peaks: full-service prices surged as high as 9.0% year-over-year in 2022, while limited-service prices peaked at 8.2% in April 2023.
Expectations Index: A Glimmer of Optimism
The Expectations Index, a gauge of restaurant operator optimism, improved in April 2025.
Climbing 1.2% from its March level, it reached 100.0, reflecting improved expectations for same-store sales, staffing, capital expenditures and the business climate.
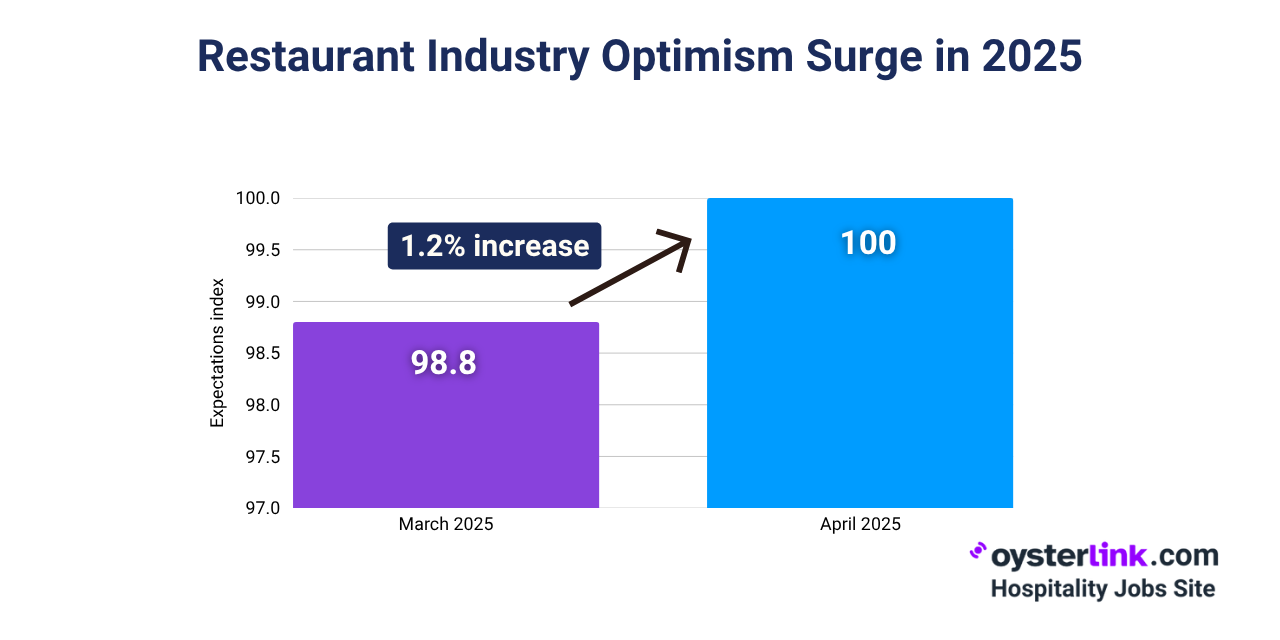
This indicates a slightly more optimistic view for sales in the coming months, although concerns about the overall economy persist.
Restaurant Employment Gains: Recovering Lost Ground
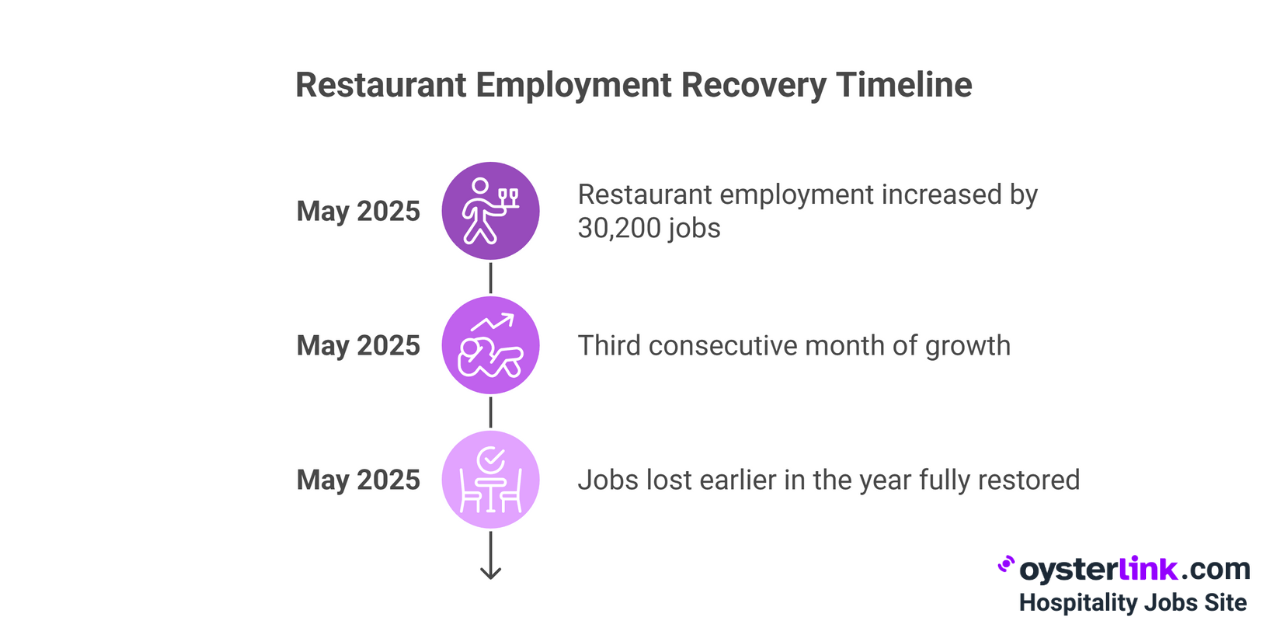
In May 2025, restaurant employment increased by a net of 30,200 jobs, marking the third consecutive month of growth and fully restoring jobs lost earlier in the year.
This sustained job growth signals a positive trend for the industry's labor market.
Restaurant Employment Above Pre-Pandemic Levels: A Milestone Achieved
As of May 2025, employment in eating and drinking places is now 105,300 jobs (or 0.9%) above pre-pandemic February 2020 levels.
This represents a significant milestone, indicating the industry has not only recovered from pandemic-related job losses but has also surpassed its pre-pandemic employment peak.
Restaurant Job Growth Uneven Across States
The restaurant job growth is different depending on the state. In the mountain states, it has climbed well beyond pre-pandemic levels.
This group is led by Idaho (+16%), Nevada (+14%), Utah (+14%) and Arizona (+11%).
Methodology
This report relies primarily on data and analysis published by the National Restaurant Association, a leading authority on the U.S. restaurant industry.
The National Restaurant Association provides a wealth of information on economic trends, consumer behavior and operational practices within the restaurant sector, making their reports invaluable for this analysis.
About OysterLink
OysterLink is a dedicated platform that links hospitality professionals with employers, making it easy to discover premium hospitality opportunities or find the perfect candidates quickly.
For job seekers, it offers salary insights, career guidance and access to top job listings.
For employers, it provides powerful tools to craft compelling job ads, identify ideal candidates and access essential business resources.
The Fastest Growing
Restaurant & Hospitality Job Platform
Looking for top paid jobs? Or Hiring for your business?


Loading comments...