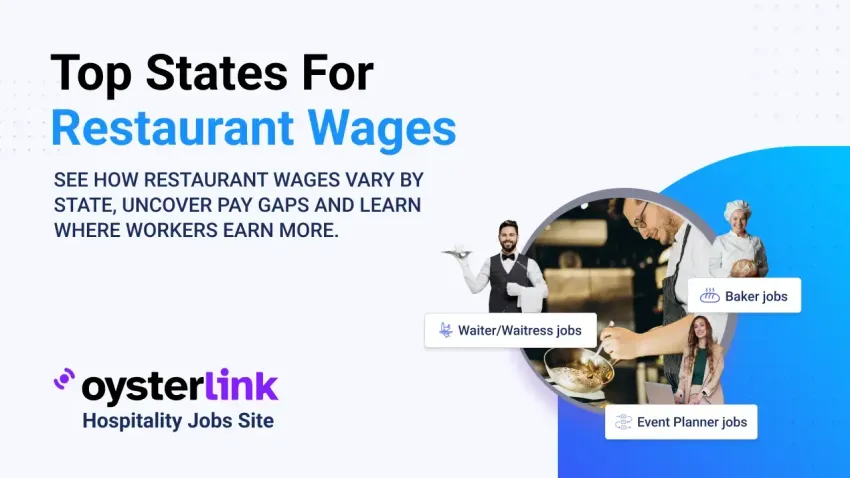
With rising labor costs and increased scrutiny of tipped pay, states are taking varied approaches to restaurant wages. Some guarantee full base pay plus tips, while others still use outdated tip credit systems — creating wide differences in earnings.
This report uses data from the U.S. Department of Labor (DOL), Bureau of Labor Statistics (BLS) and Toast’s Q2 2024 tipping trends to reveal where restaurant workers earn the most in 2025.
Restaurant Wages: National Overview
The average hourly earnings in the leisure and hospitality sector increased from $21.87 in April 2024 to $22.70 in April 2025, reflecting a 3.8% year-over-year growth.
This rise can be attributed to several factors, including inflation-indexed minimum wage hikes in multiple states, persistent labor shortages that pushed employers to offer more competitive pay and growing public and legislative pressure to improve compensation standards across hospitality roles.
This wage growth signals a positive trend, contributing to improved earnings and job stability for workers in the industry. Roles within this sector include:
- Waiters: $17.56 per hour
- Bartenders: $17.83 per hour
- Dishwashers: $15.22 per hour
- Chefs and Head Cooks: $30.12 per hour
- Fast Food and Counter Workers: $14.48 per hour
Check Our Career Growth Tools
Top 10 States with the Highest Restaurant Wages
Here are the top 10 states offering the highest potential earnings for restaurant workers in 2025.
This ranking considers both the state-mandated minimum wage and the average tipping percentage, providing a comprehensive view of potential income for restaurant employees.
Rank | State | Minimum Wage | Tipped Min. Wage | Avg. Tip % | Notes |
| 1 | Washington | $16.66 | $16.66 | 17.8% | No tip credit; full minimum wage required for all employees. |
| 2 | California | $16.50 | $16.50 | 17.3% | No tip credit; full minimum wage required for all employees. |
| 3 | Oregon | $15.95 | $15.95 | 19.0% | No tip credit; full minimum wage required for all employees. |
| 4 | Massachusetts | $15.00 | $6.75 | 19.3% | High average tip percentage enhances earnings potential. |
| 5 | Colorado | $14.81 | $11.79 | 19.5% | Competitive tipped wage and high tipping culture. |
| 6 | Arizona | $14.70 | $11.70 | 19.1% | Strong base wage with generous tipping practices. |
| 7 | Illinois | $15.00 | $9.00 | 19.0% | Solid minimum wage and tipping environment. |
| 8 | Vermont | $14.01 | $7.01 | 19.4% | Balanced wages with favorable tipping rates. |
| 9 | Connecticut | $16.35 | $6.38 | 19.1% | High state minimum wage supports overall earnings. |
| 10 | New York | $16.50 | $10.00 | 18.7% | Regional variations; NYC area offers higher base wages. |
How We Evaluated Restaurant Wage Potential by State
This ranking is based on data from the U.S. Department of Labor for both standard and tipped minimum wages, along with tipping behavior insights from Toast’s Q2 2024 Restaurant Trends Report.
States were evaluated using a combination of factors: high base pay, tipped wage policies that favor employees (e.g., states that do not allow a tip credit) and consistently strong average tip percentages.
While this provides a comparative look at earnings potential, it's important to note that some local ordinances set higher minimum wages than state levels, and tipping behavior can vary significantly across regions.
Additionally, this analysis does not factor in cost of living, job availability or other economic conditions that could impact real-world income.

The Fastest Growing
Restaurant & Hospitality Job Platform
Looking for top paid jobs? Or Hiring for your business?
Key Factors Influencing Restaurant Wages Across States
A variety of economic, legislative and industry-specific factors shape what workers actually take home. Here's a deeper look at what drives these differences:
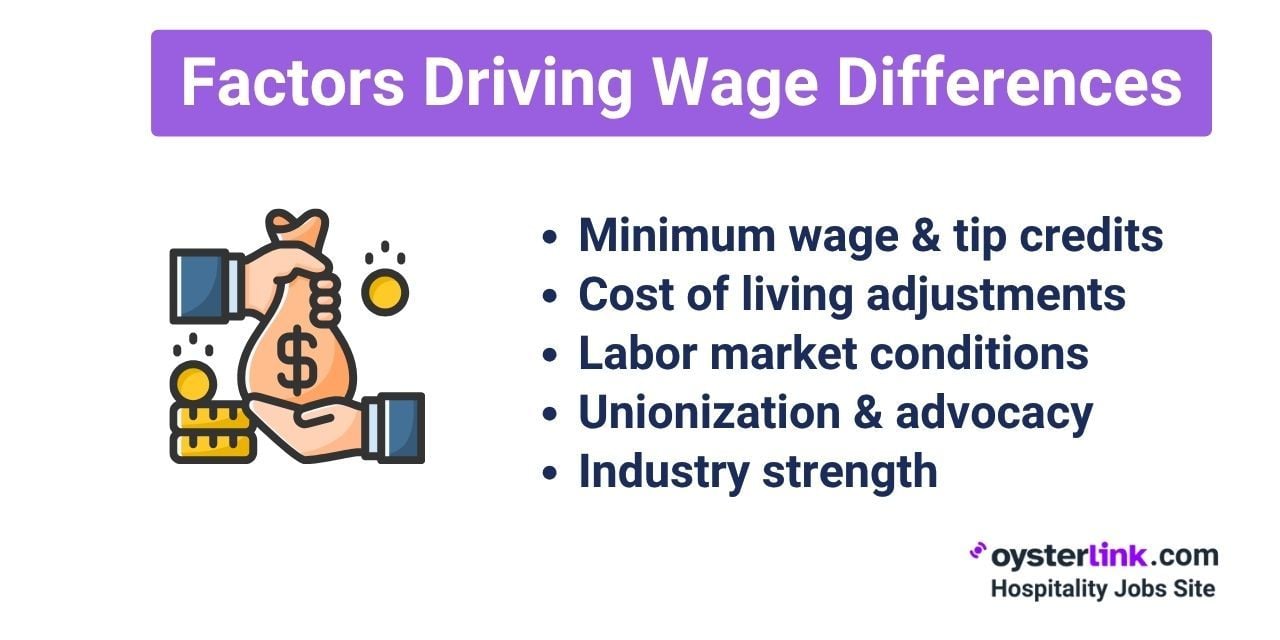
Minimum Wage and Tip Credits
How much you earn in a restaurant job isn’t just about your hourly wage — it’s also about how your state treats tips.
Some states require employers to pay the full state minimum wage before tips. In these states, tips are a bonus on top of base pay.
But in over a dozen other states, employers can count tips toward the minimum wage using a system called a tip credit. That means your base pay could be as low as $2.13 per hour, with the expectation that tips will make up the difference.
While employers are legally required to ensure your total earnings hit the minimum wage, enforcement is inconsistent — especially in non-unionized or understaffed workplaces.
Cost of Living and Urban Market Adjustments
In theory, higher cost-of-living areas — like San Francisco, New York City or Seattle — offer higher wages to offset living expenses. But in practice, the adjustment isn’t always proportional.
According to MIT’s Living Wage Calculator, some high-rent cities still fall short of paying restaurant workers enough to cover basic needs. Local wage ordinances can help bridge that gap, which is why you’ll often see city-specific minimum wage rates that exceed the state baseline.
Below is a comparison of New York City’s minimum wage and the estimated living wage for a single adult with no children.
Unionization and Worker Advocacy
Union presence and worker-led campaigns play a critical role in pushing for wage increases. In states with active labor organizing — such as New York, Massachusetts and Illinois — hospitality unions have historically lobbied for higher base pay, paid leave and fair tip distribution.
Labor Market Conditions and Worker Shortages
The post-pandemic hospitality labor shortage has given restaurant workers more negotiating power in some regions. Employers in high-demand markets, such as Las Vegas or Austin, have raised wages or offered signing bonuses to attract and retain talent.
Cities facing staffing shortages are more likely to pay above the legal minimum, especially for back-of-house roles that are harder to fill.
According to the National Restaurant Association, 70% of operators report having job openings that are tough to fill, while 45% say they don’t have enough employees to support existing customer demand.
Industry Strength and Economic Anchors
Tourist-heavy cities like Orlando, Honolulu and Nashville often see higher restaurant traffic, which can result in better tipping opportunities and busier shifts.
In contrast, smaller markets or seasonal towns may experience volatile earnings. Economic anchors — like a strong tech sector in Seattle or convention traffic in Chicago — also contribute to more consistent foot traffic and higher customer spending.
State-by-State Tipping Practices and Their Impact on Restaurant Wages
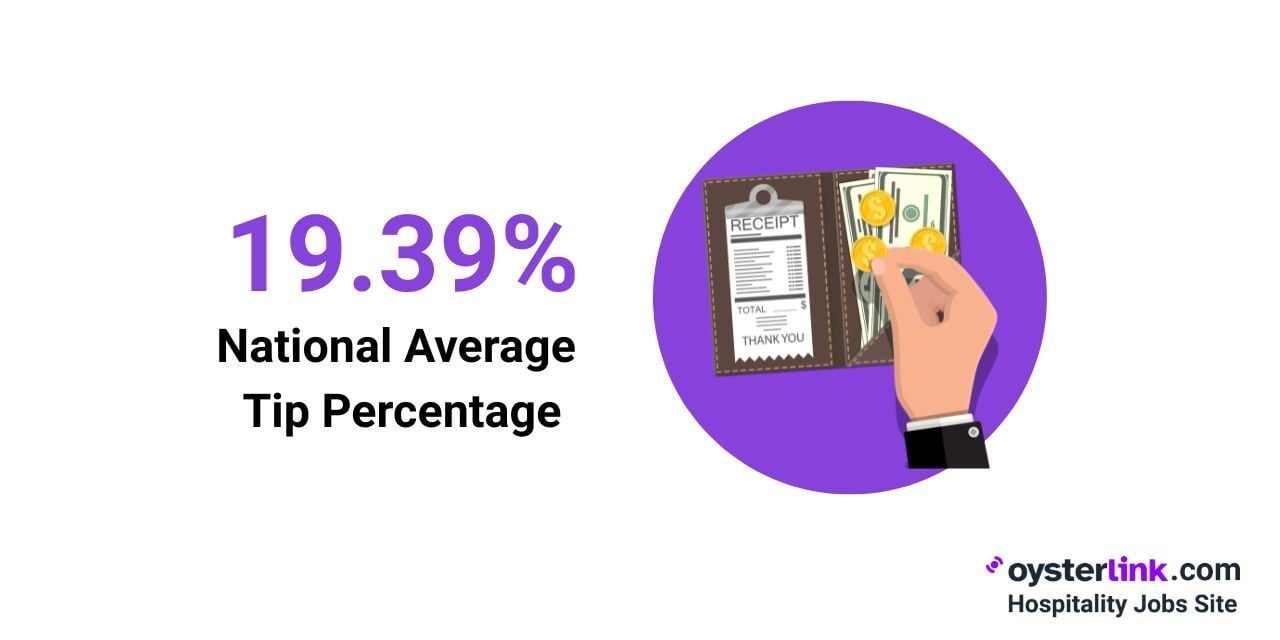
Tipping behaviors play a critical role in total income for restaurant workers, especially in states where tipped minimum wages are significantly lower than standard minimum wages.
According to 2024 data, the national average tip percentage is 19.39%, but tipping culture varies widely by state.
- Delaware: 21.5%
- West Virginia: 20.5%
- Indiana: 20.4%
- New Hampshire: 20.4%
- Kentucky: 20.3%
These higher-than-average tipping rates can substantially boost take-home pay, particularly in full-service dining environments where tipping is standard.
However, it’s important to note that tip percentage alone doesn’t guarantee higher earnings. States like Delaware and West Virginia still allow a low tipped minimum wage.
In contrast, states with moderate tip percentages but stronger labor protections — like California and Oregon, where tipped workers receive the full minimum wage regardless of tips — often offer more stable and predictable income for restaurant staff.
So while a generous tipping culture is a strong asset, it has the most impact when combined with favorable wage laws that support workers' earnings across both slow and busy shifts.

Restaurant Wages by State: Conclusion
Restaurant wages differ sharply by state. Workers fare best where full minimum wage is guaranteed, not just tips. Despite modest wage growth, many still earn below what’s needed to get by — especially in high-cost cities. Location remains a key factor in real earnings.


Loading comments...