Sous Chef Demographics and Statistics in the US – 2026
We’ve created a list of top Sous Chef statistics and demographics in the United States.
Keep reading to learn how many Sous Chefs are women, where they work and more.
- The average Sous Chef Salary in the United States is $56,013
- The average Sous Chef salary in Miami is $60,151 per year
- Sous Chefs working in NYC earn $67,503 per year on average
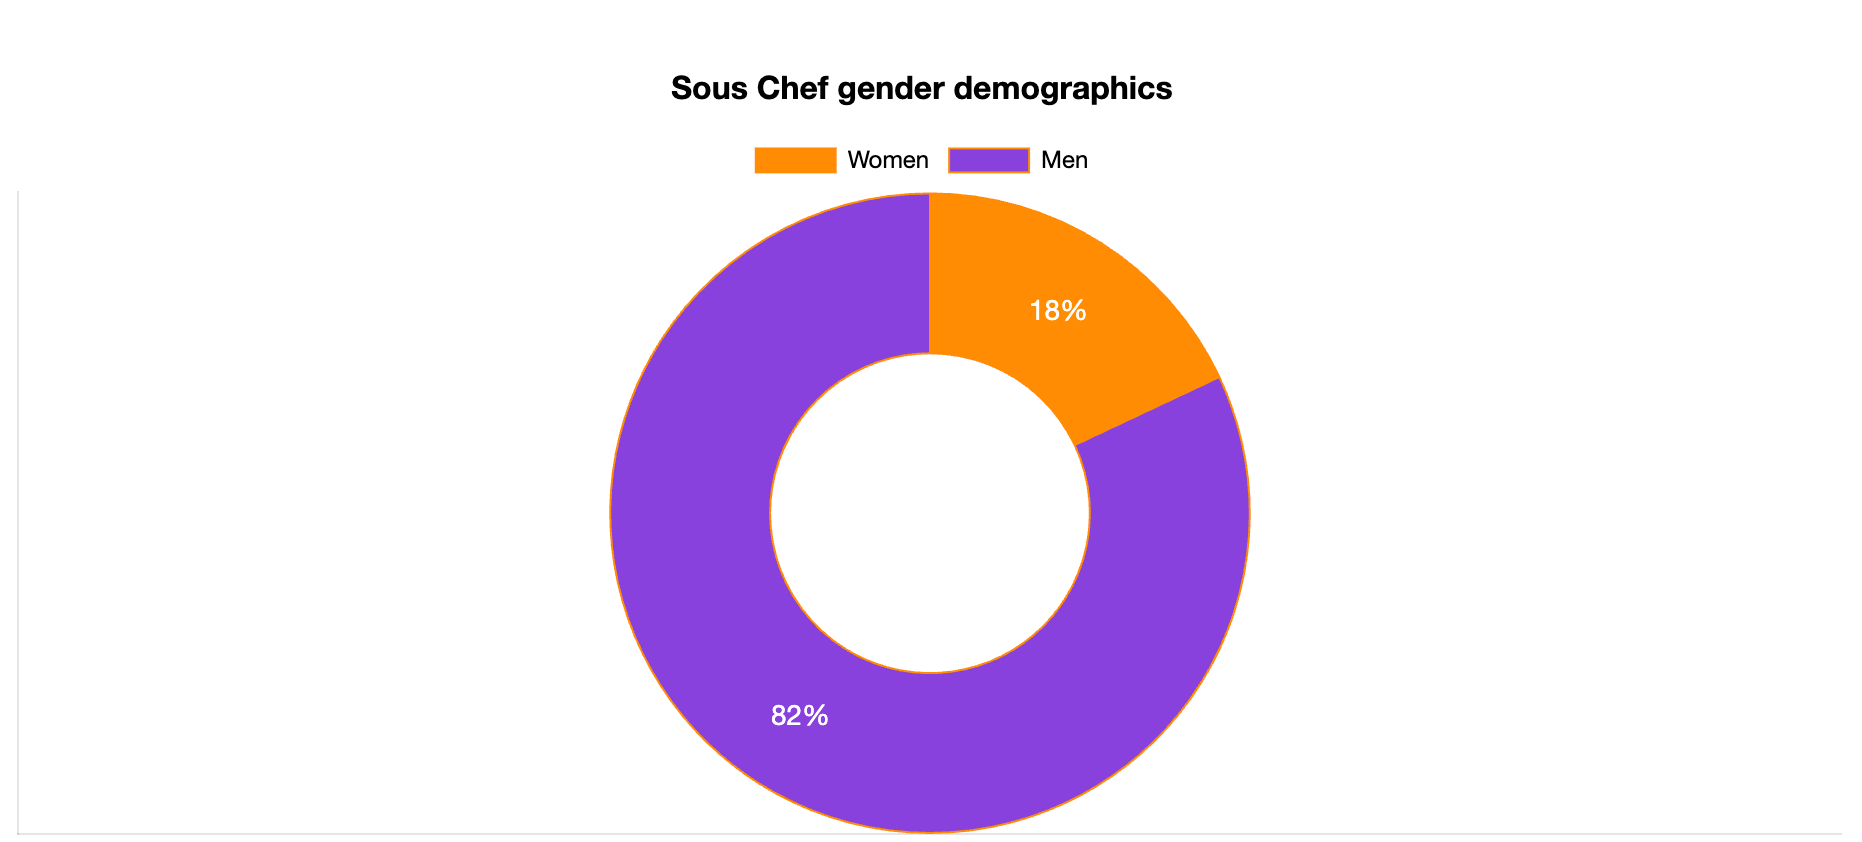
- 82% of Sous Chefs are men
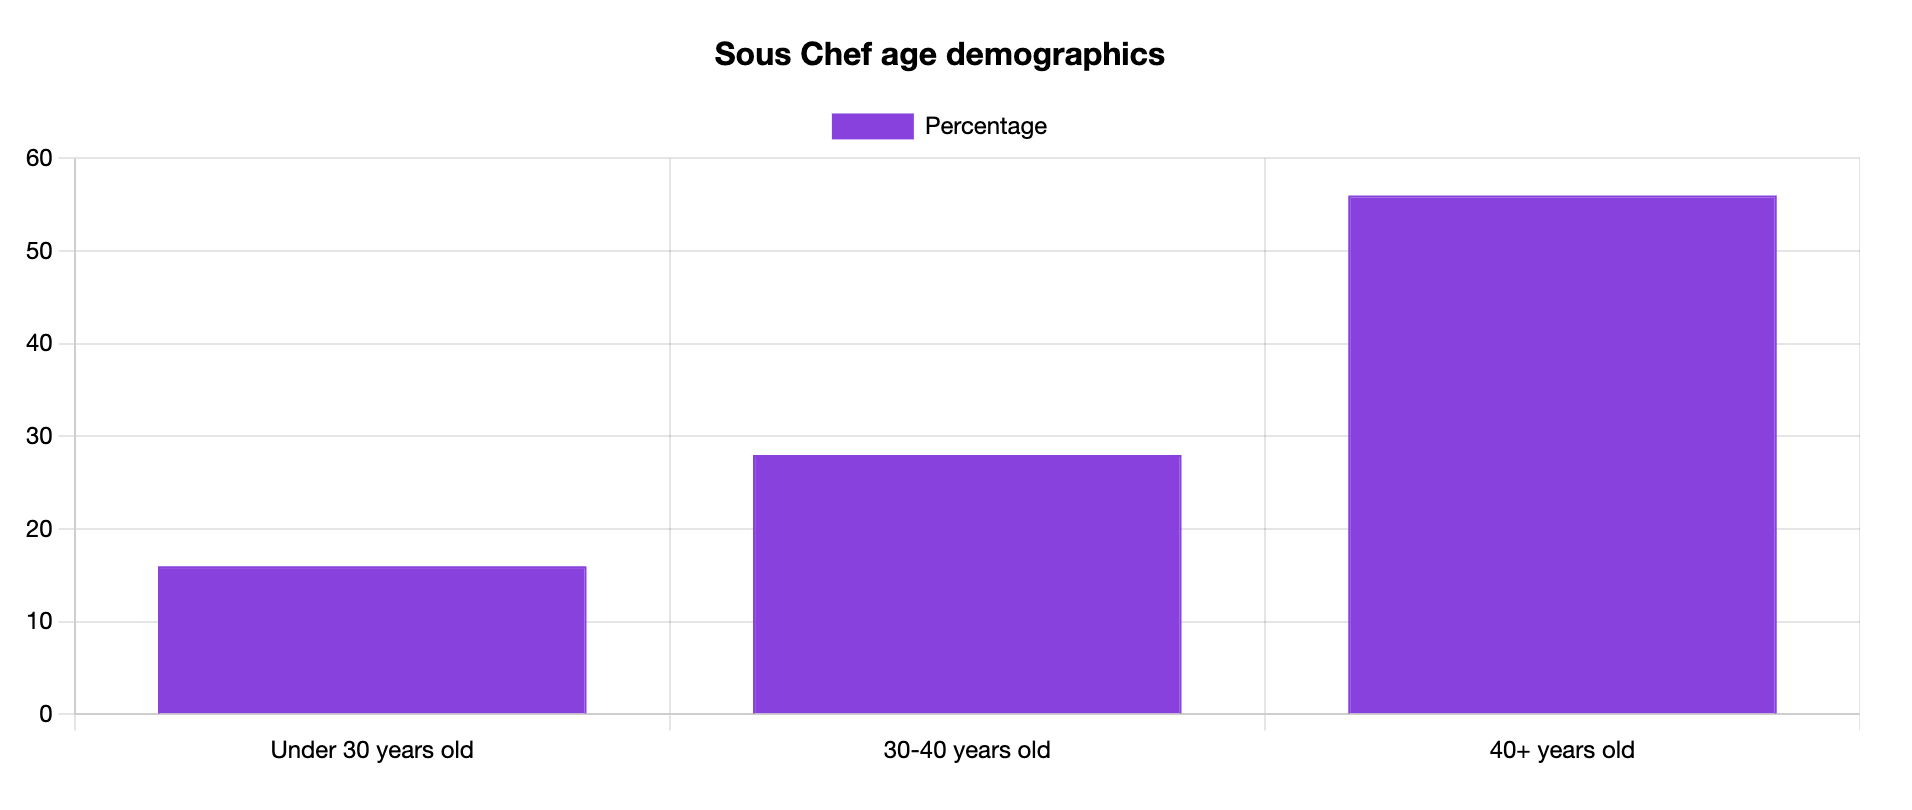
- 56% of Sous Chefs are older than 40
Sous Chef Employment Statistics
There are more than 111,000 Sous Chefs in the United States. This number is almost the same to the number of Head Chefs, as you can see on our Head Chef demographics page.

Sous Chef Gender Statistics
Out of all the Sous Chefs working in U.S., only 18% are women. This is similar to the demographics of Executive Chefs.
Sous Chef Age Statistics
Most Sous Chefs are older than 40 years, while 28% of them are between 20 and 30 years old.
See how old Sous Chefs are below.
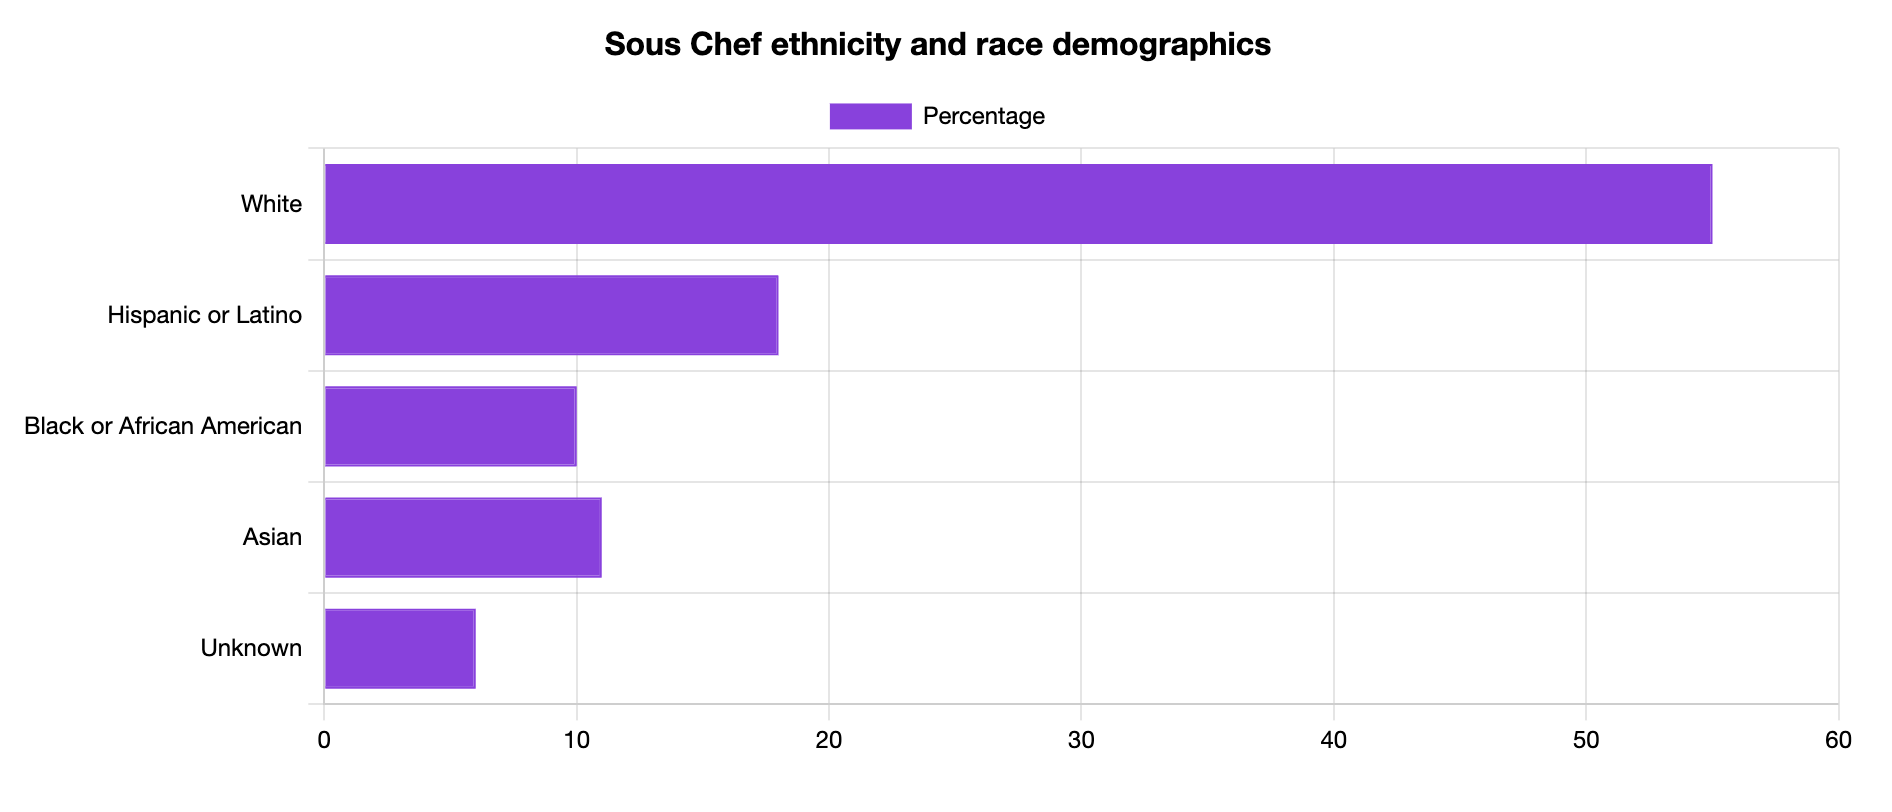
Sous Chef Ethnicity and Race Statistics
While the majority of Sous Chefs are white, 18% of them are Hispanic or Latino and 11% of them are Asian.
See the breakdown of Sous Chefs in the United States by race and ethnicity.
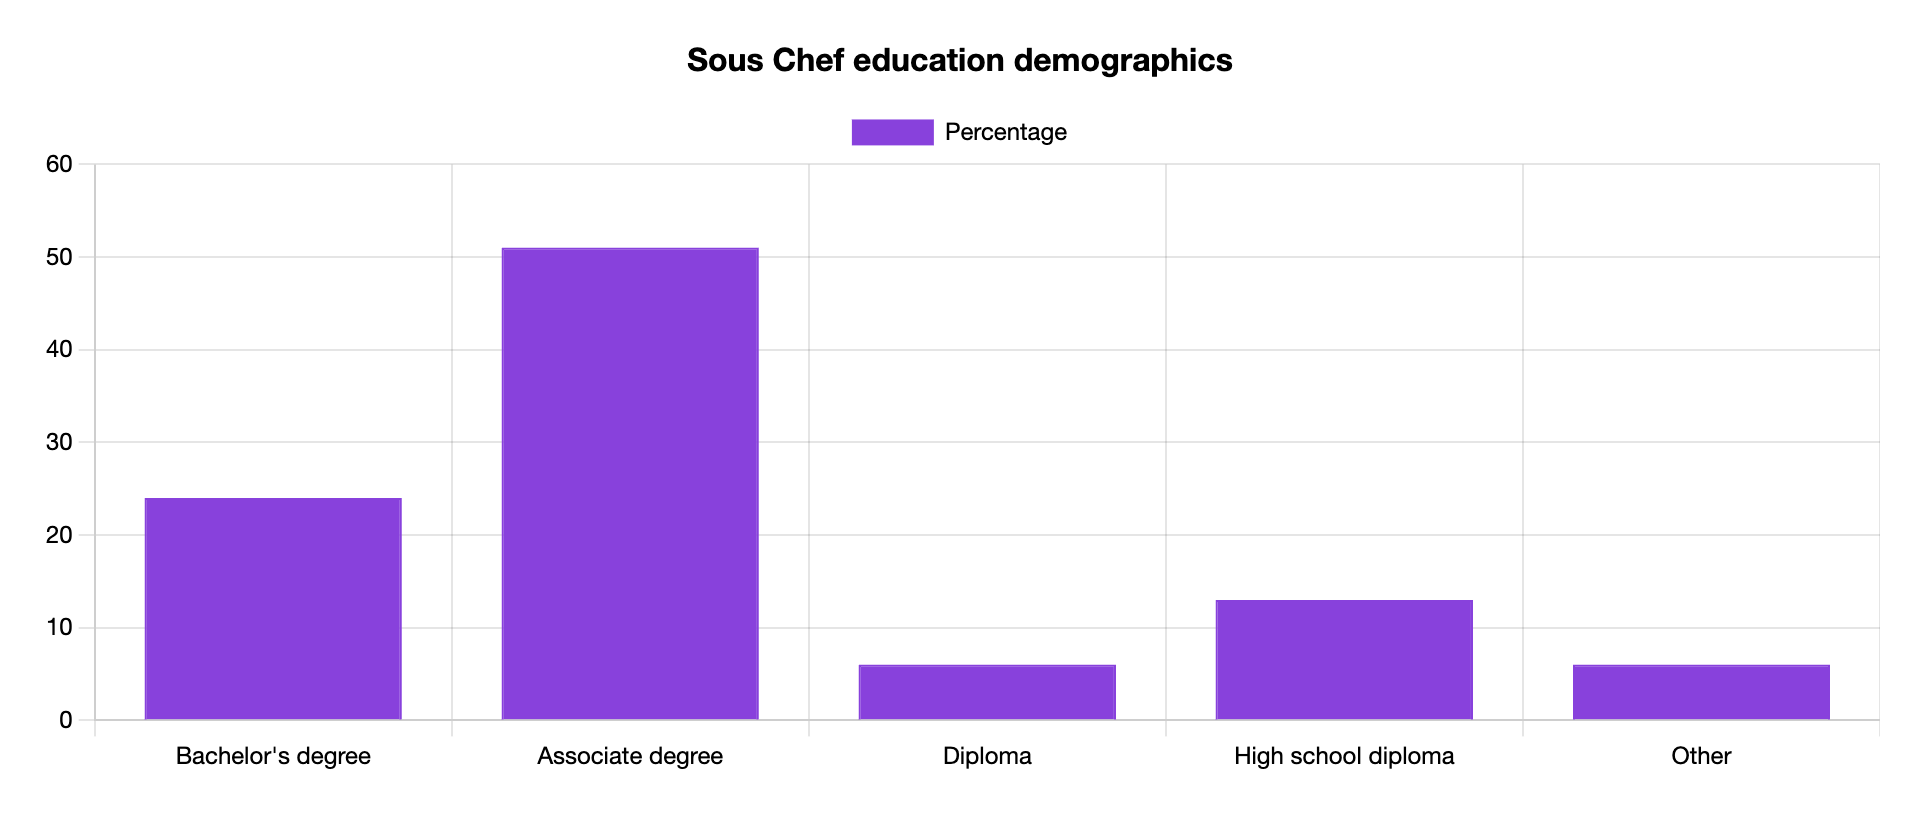
Sous Chef Education Statistics
While it is possible to become a Chef without culinary school, most Sous Chefs have an associate’s degree, followed by 24% of them who have a bachelor’s degree and 14% with a high school diploma.
Sous Chefs are typically more educated than other, entry-level hospitality roles, as you can see on our Prep Cook demographics page.
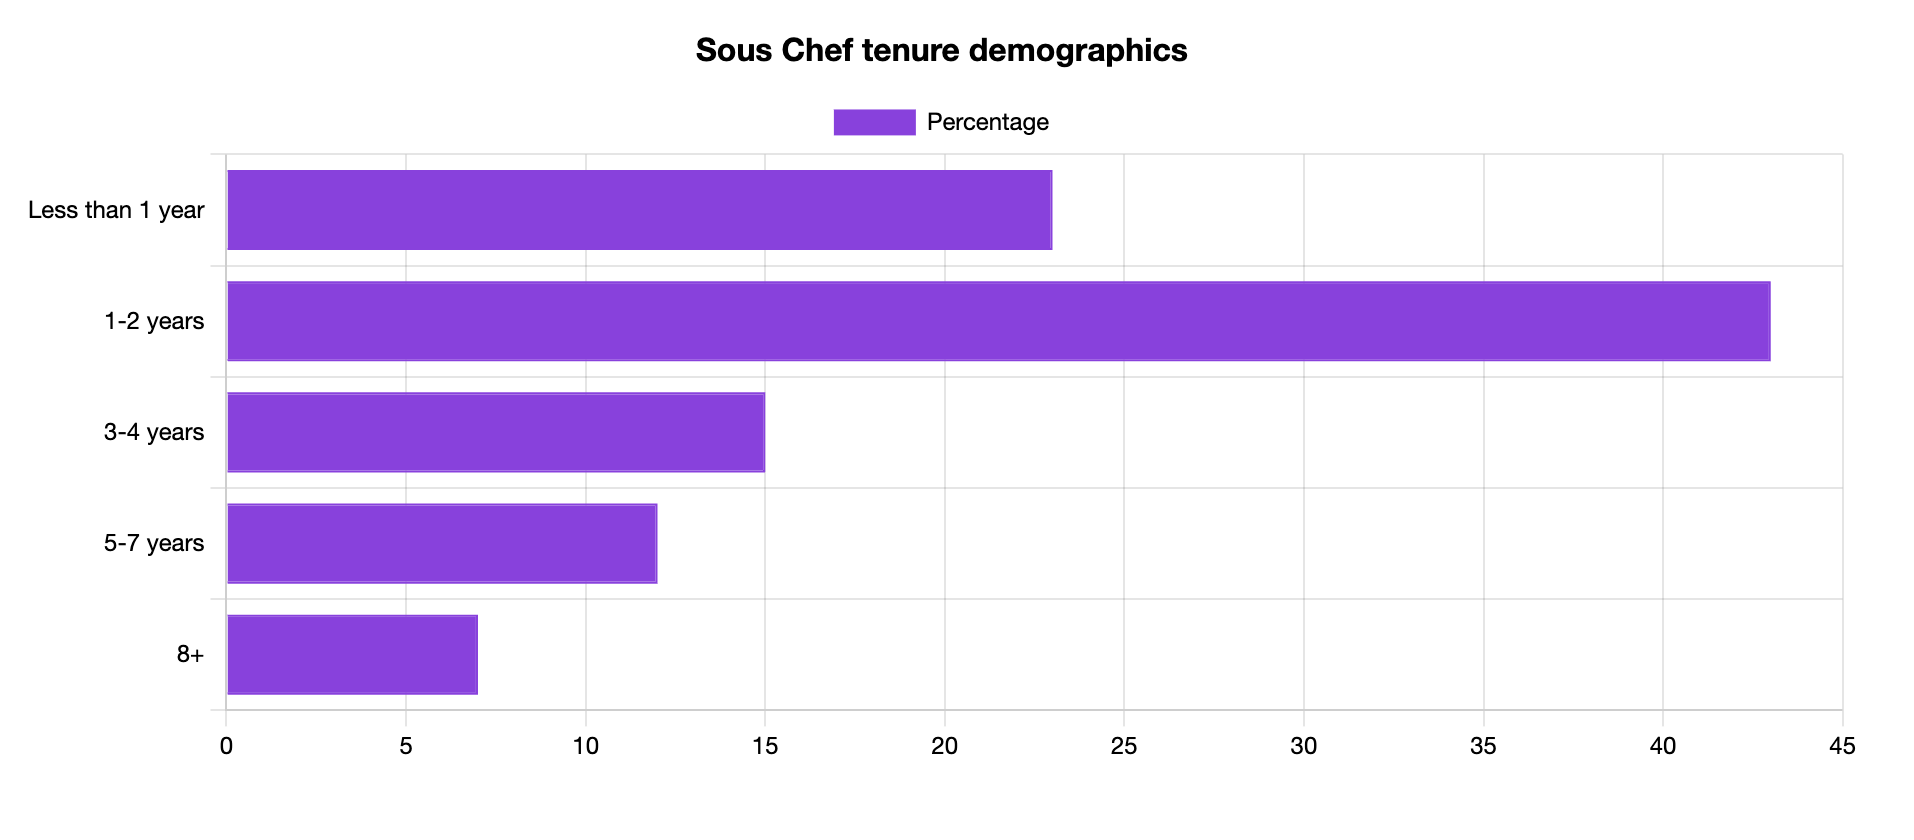
Sous Chef Tenure Statistics
23% of Sous Chefs stay with the same employer for up to a year. Even though the hospitality industry has a high turnover rate, and Chefs commonly change employers, there are those (7%) who stay with the same employer for more than eight years.
See the breakdown of Sous Chef tenure below.
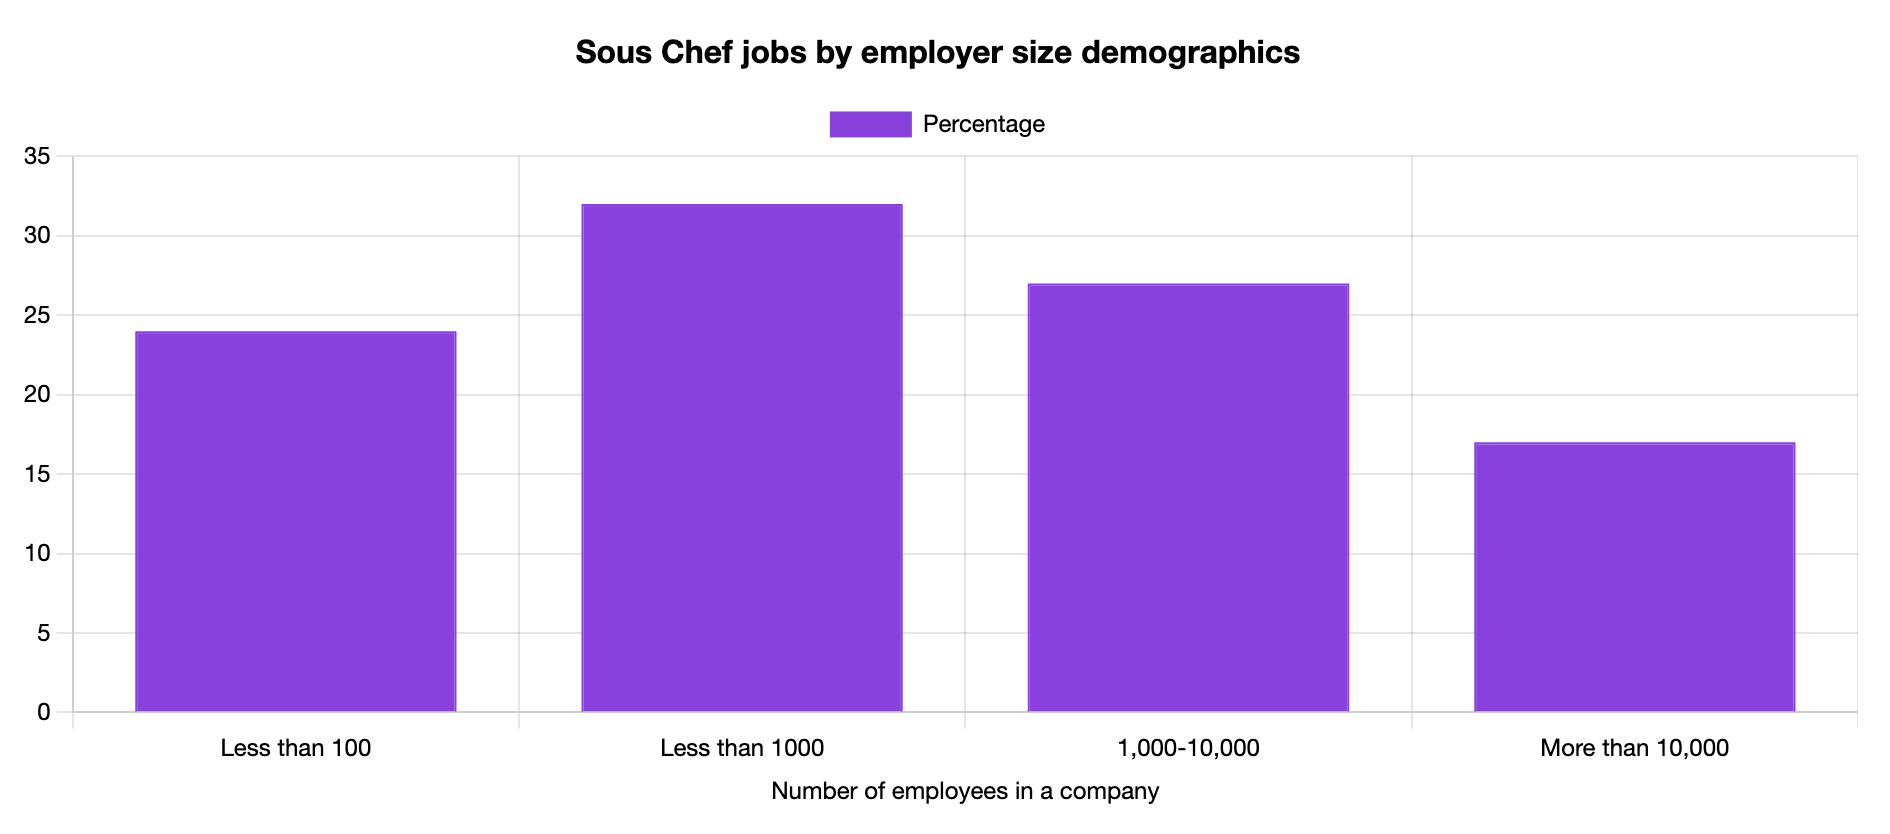
Sous Chef Jobs by Company Size
Sous Chefs can work in various establishments across industries.
As such, the size of their employers can greatly vary.
While 24% of them work for employers that have less than 100 employees, there are those who work for companies that employ between 1,000 and 10,000 people.
See the breakdown of Sous Chef employment by the size of their employer below.
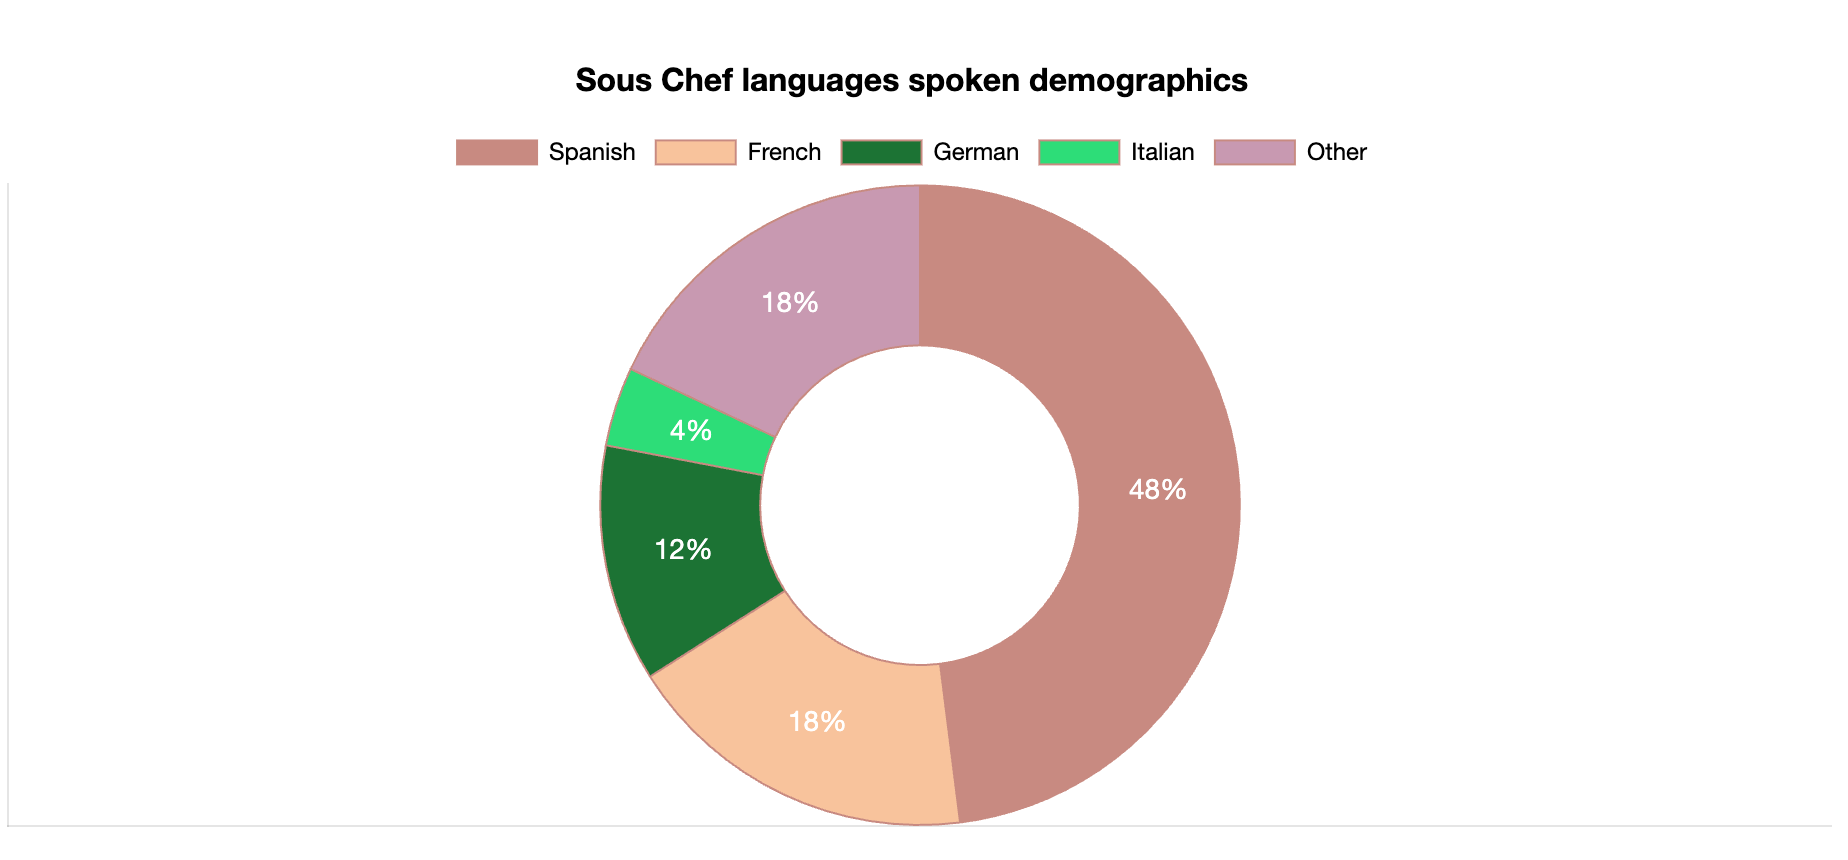
Sous Chef Languages Spoken
Sous Chefs in the United States speak languages aside from English. The most popular second language is Spanish (49%), followed by French (18%) and Italian (12%).
See the breakdown of second languages that Sous Chefs speak below.
Additional Sous Chef Statistics
- 55% of all Sous Chefs are white
- 51% of all Sous Chefs have an associate degree
- 43% of Sous Chefs stay with the same employer for up to two years
Sous Chef Statistics and Demographics Data
We collect our data from multiple government and agency websites.
See how we do it on our statistics and demographics methodology page.

Reviewed by Stefan Petrov
With over 10 years of experience as a writer and editor, Stefan has worked in the automotive, IT, health and hospitality industries. Familiar with Google Search Console and other SEO tools like Ahrefs and Semrush, Stefan uses his experience to create content that's visually appealing to the user but also ranks in the SERPs.