Valet Demographics and Statistics in the US – 2026
We’ve collected a list of top Valet statistics and demographics in the United States
Explore Valet educational attainment, how many Valets are women, where they work and more
- The average Valet salary in the United States is $32,700 base plus tips per year
- Top-earning Valets (90th percentile) earn as much as $40,500 annually without tipsValets that earn the least money in this role (10th percentile) earn as little as $22,890 without tips
- Valets that earn the least money in this role (10th percentile) earn as little as $22,890 without tips
- There are currently 105,290 individuals working as Valets or parking attendants
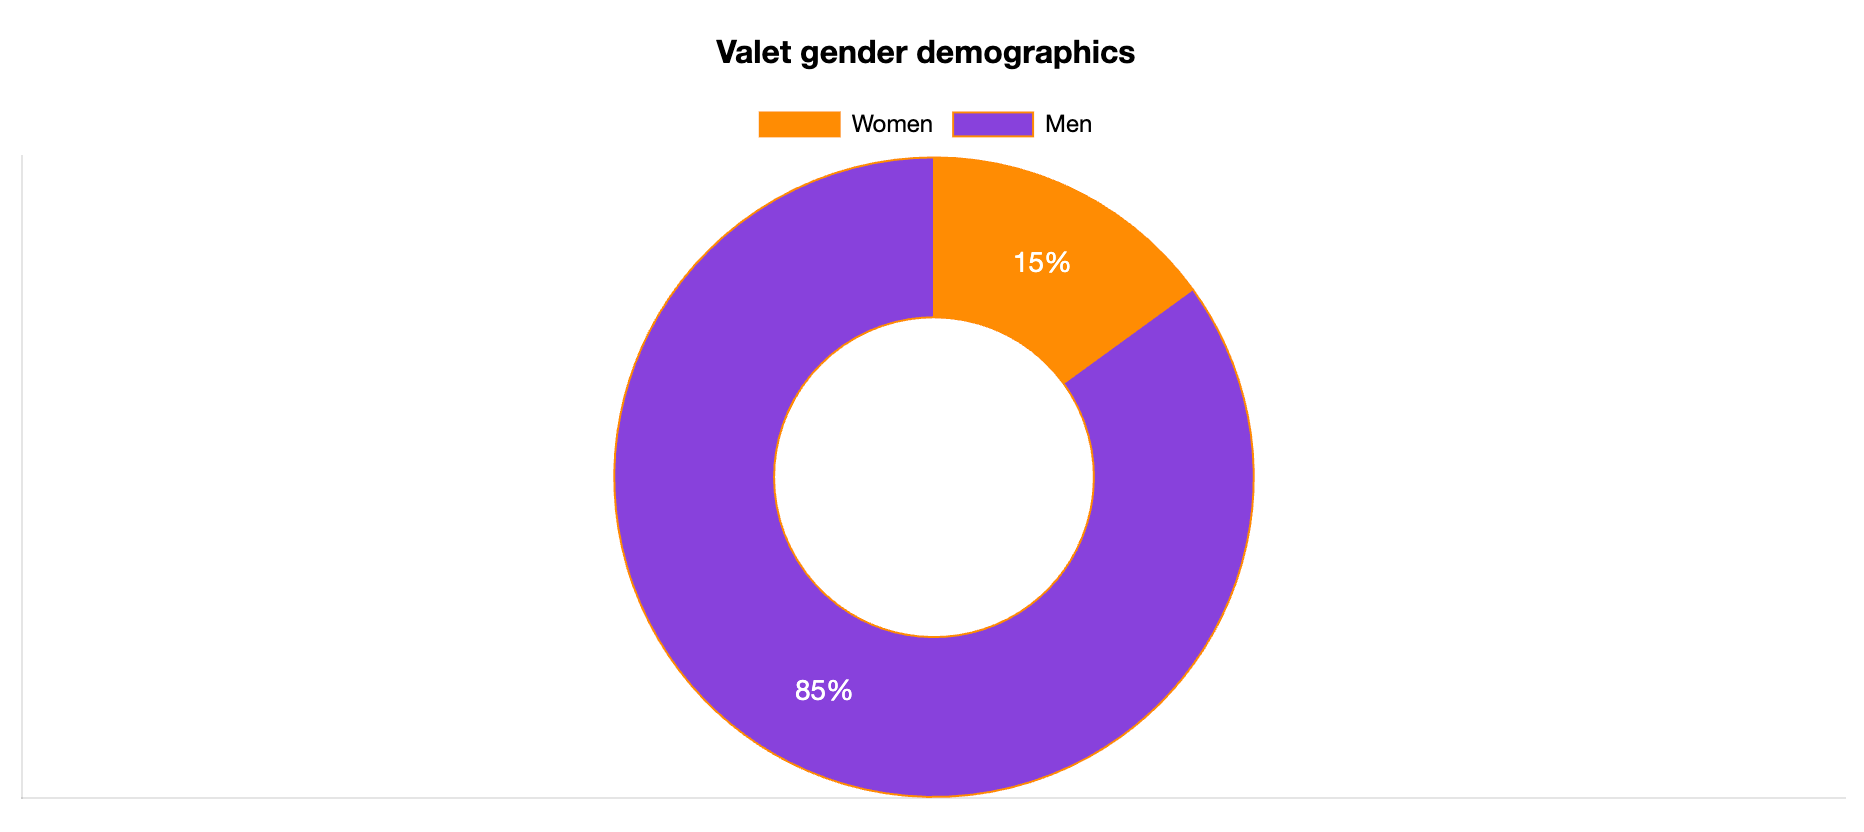
- 15% of all Valets are women
Valet Employment
In the graph below, you can see how the number of Valets in the United States changed from 2019 to 2023, according to the Bureau of Labor Statistics.
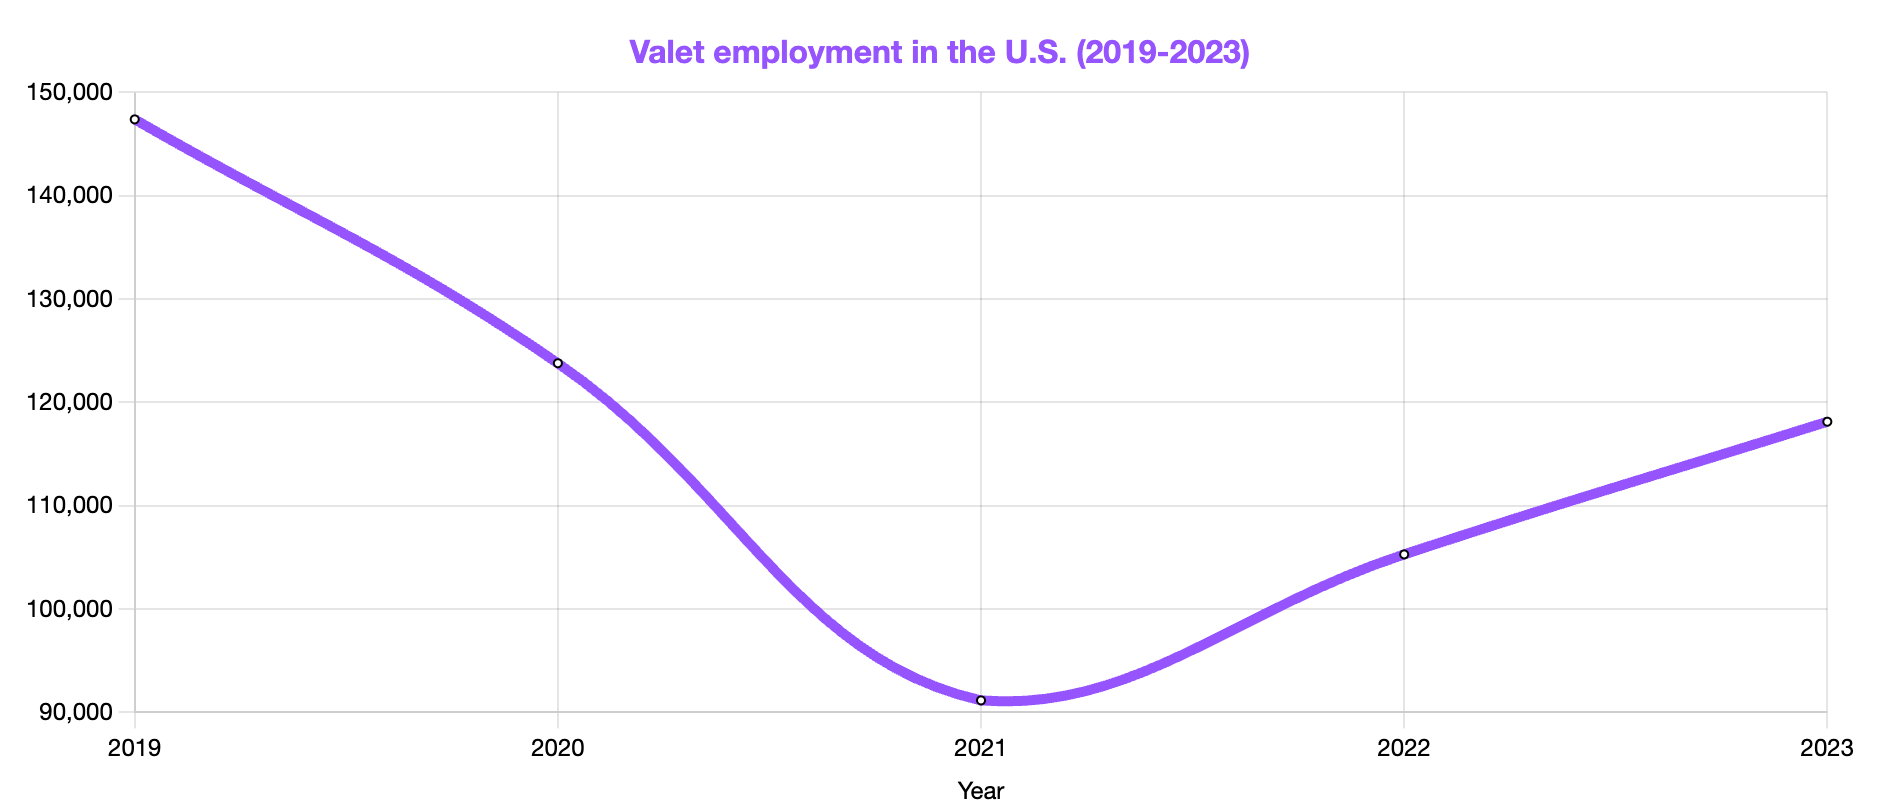
Notice that the number of Valets started dropping in 2020 and it still hadn’t returned to its pre-pandemic levels in 2023.
Valet Gender Statistics
Most individuals (85%) working as Valets in the United States are men. This is similar to the Busser role, as you can see on our Busser demographics page.
Valet Age Statistics
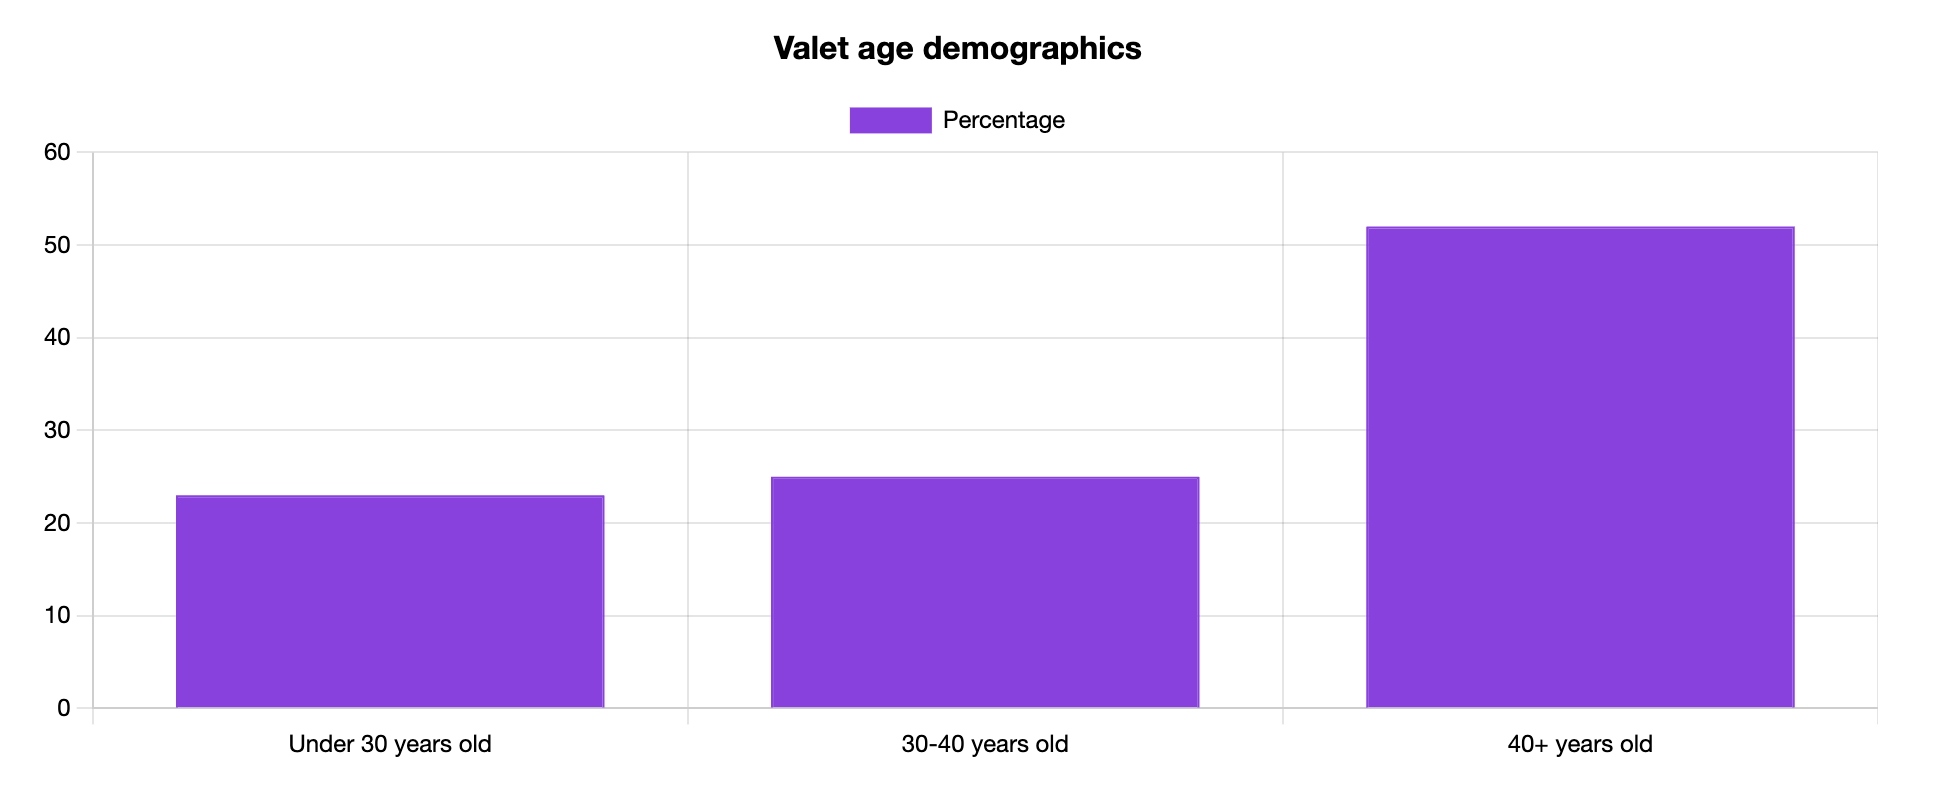
The majority of all Valets (52%) are older than 40, while 25% of them are between 30 and 40 years old.
Another role that is dominated by individuals who are older than 40 is the Barback role – see for yourself on our Barback demographics page.
Valet Ethnicity and Race Statistics
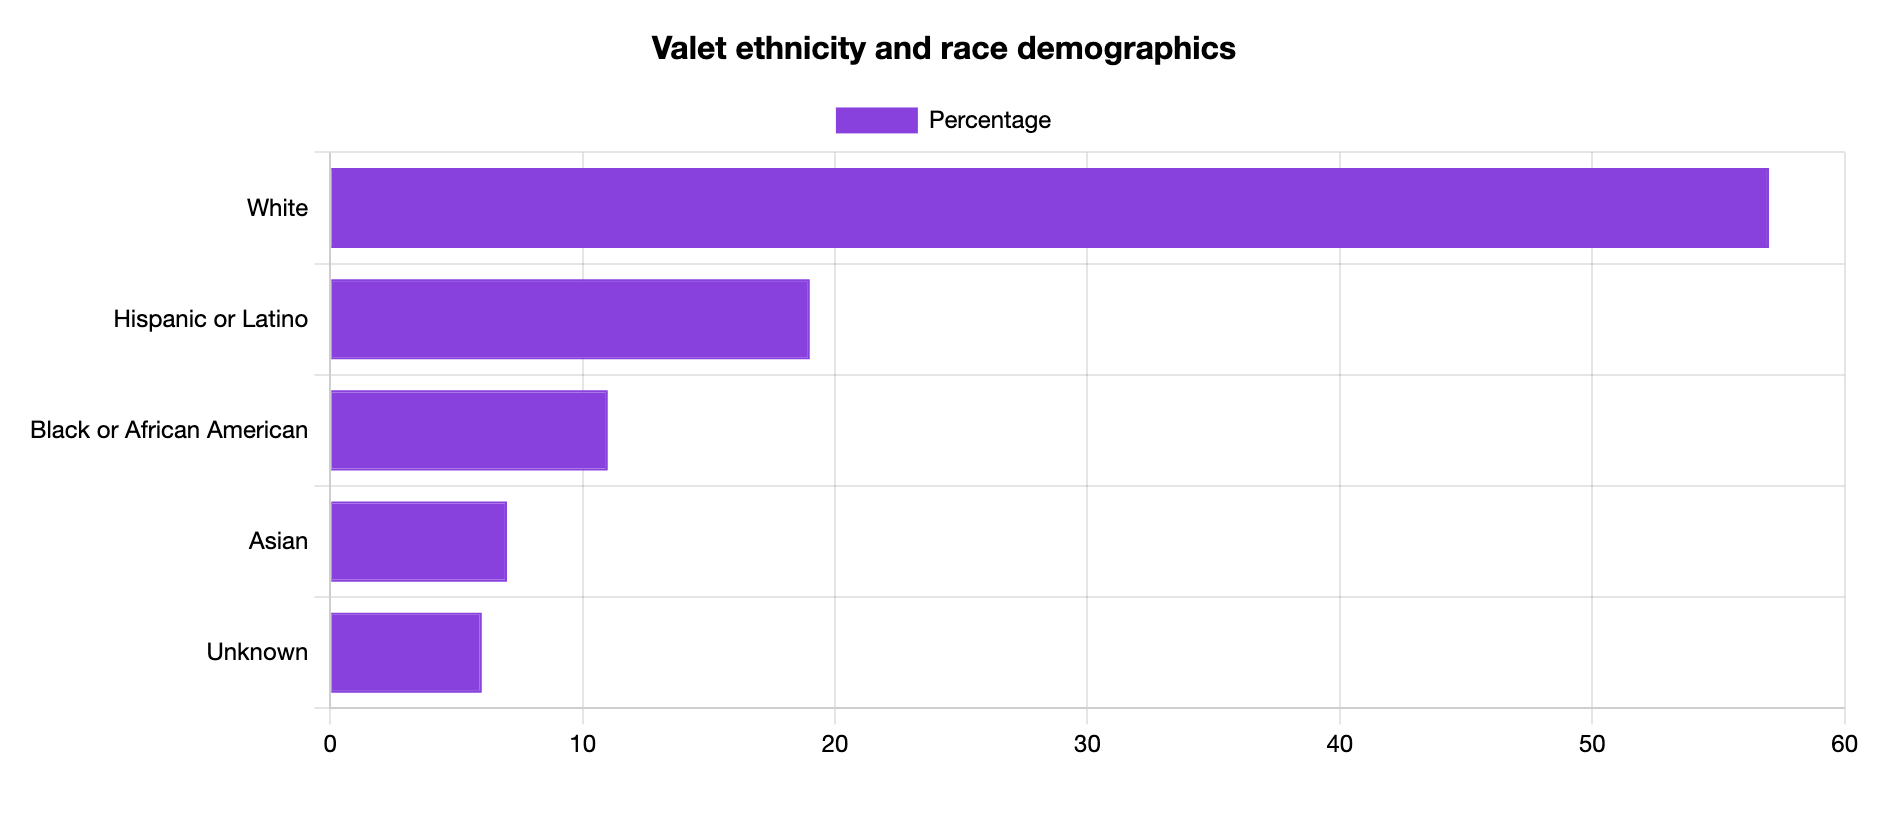
Most Valets working in the United States are white (57%).
See the breakdown of Valets by race and ethnicity statistics in the graph below.
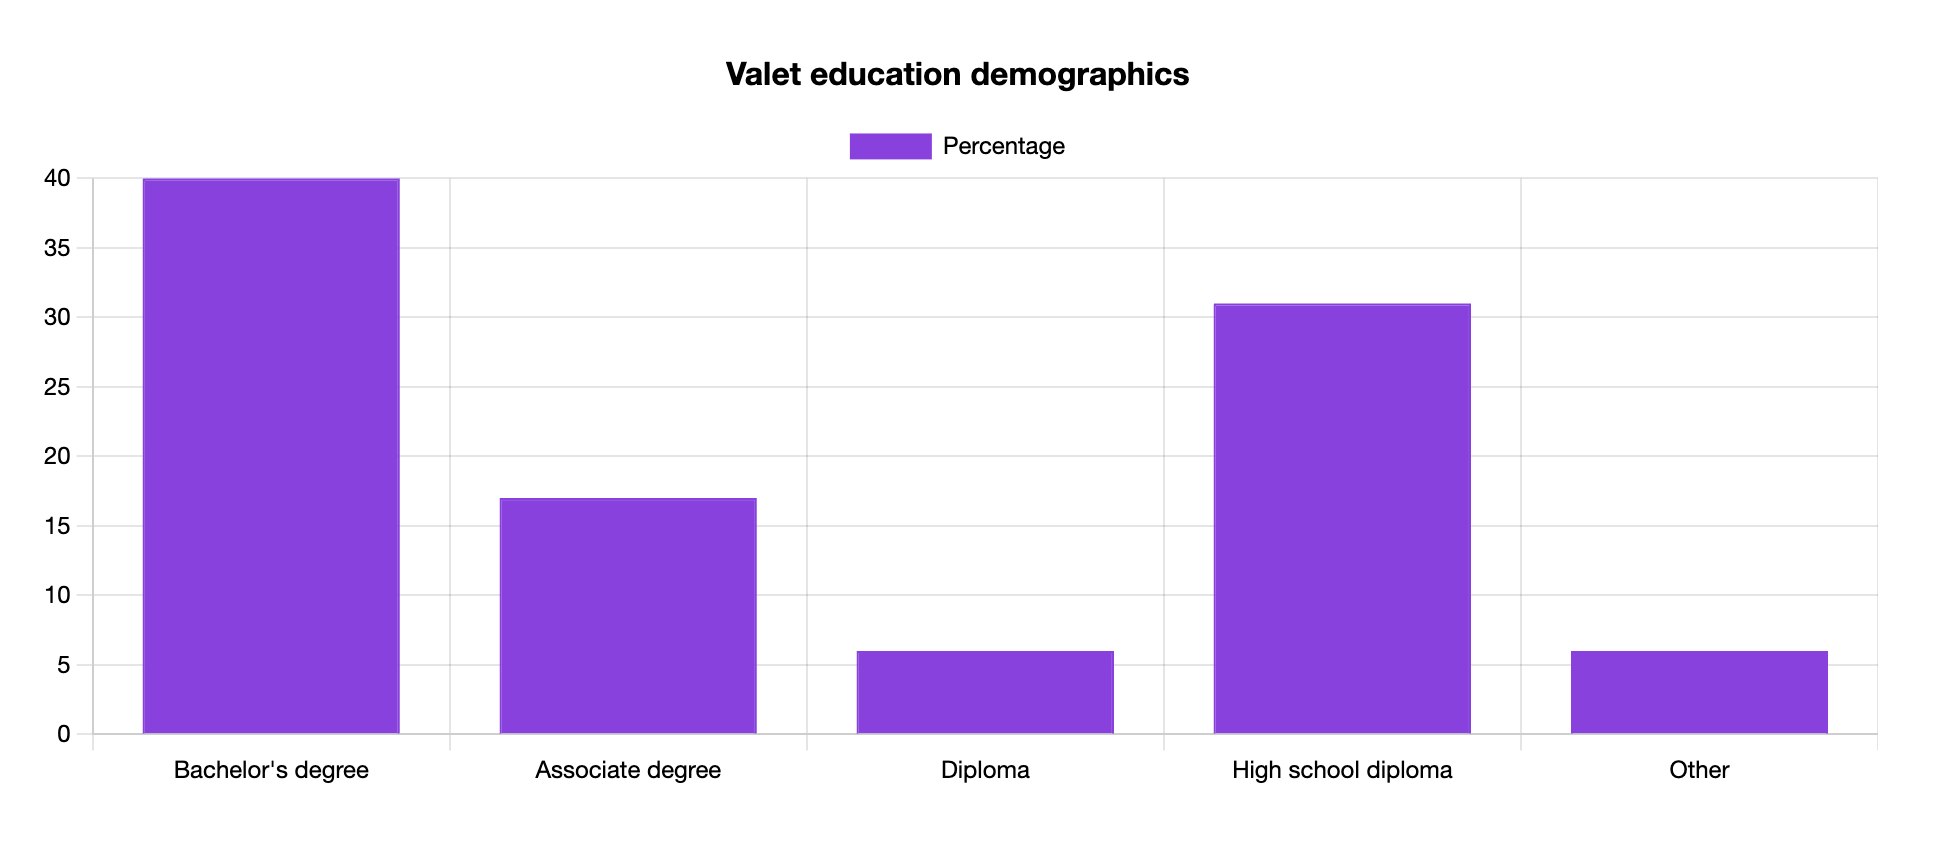
Valet Education Statistics
Most Valets (40%) in the U.S. have a bachelor’s degree, followed by 31% of Valets who have a high school diploma.
This is different from another hospitality entry-level role: the Porter. See their education on the Porter demographics page.
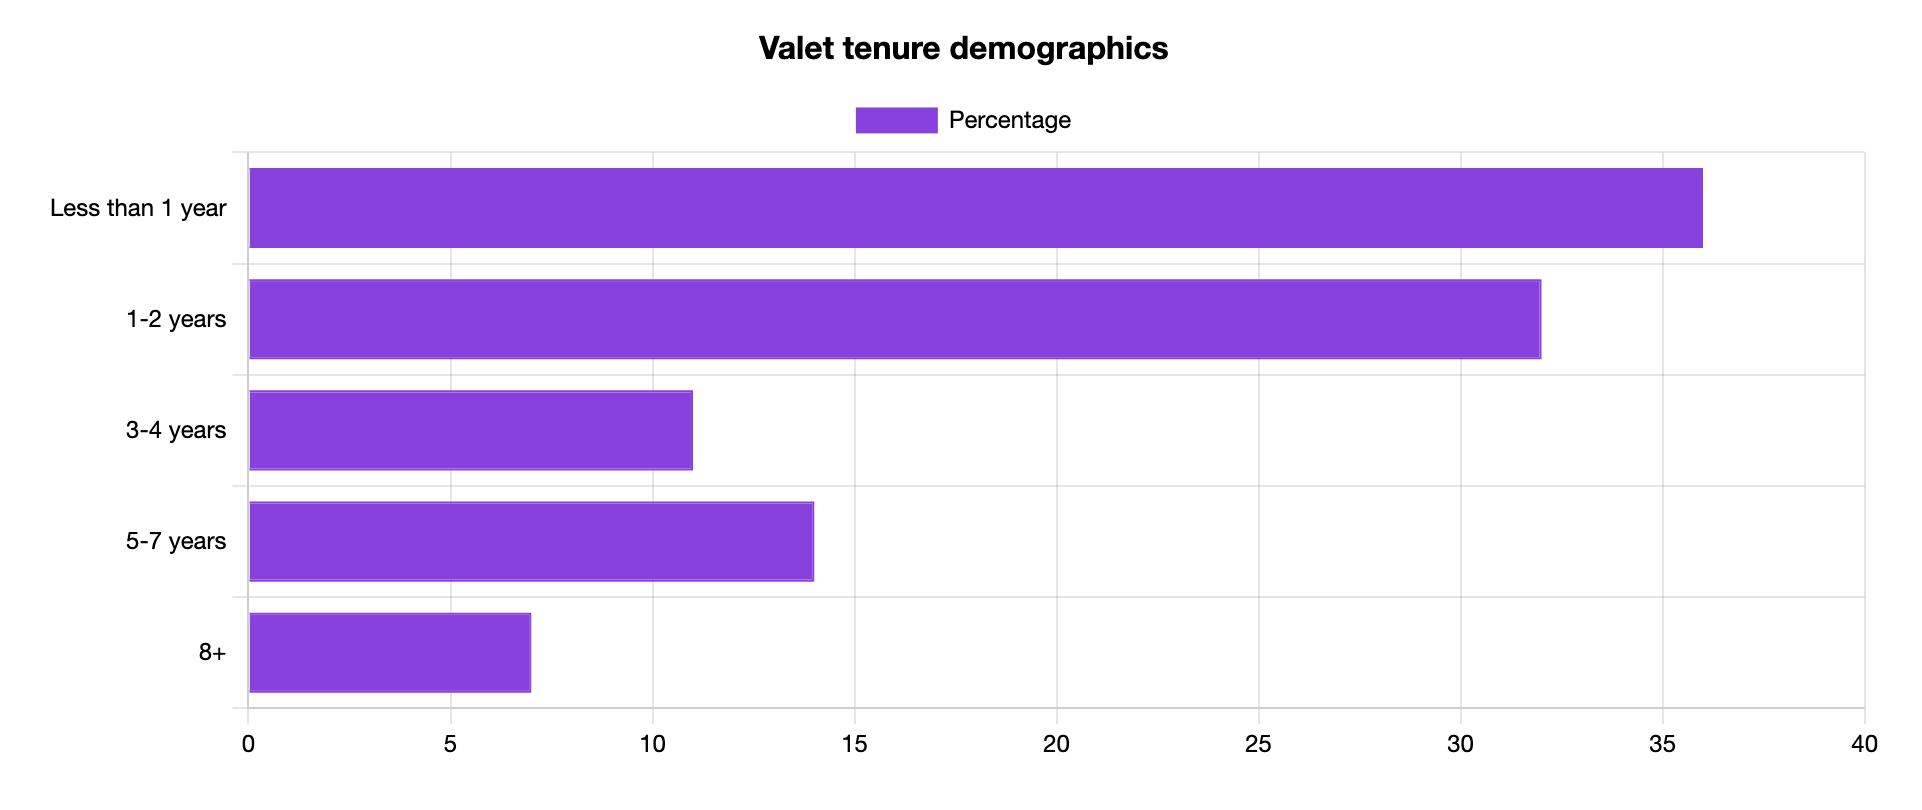
Valet Tenure Statistics
Most Valets (36%) stay at the same job for less than one year.
Of all the Valets, 32% stay at the same job between one and two years, while 14% of them stay at the same job between five and seven years.
See the breakdown of Valet tenure statistics below.
Valet Jobs by Industry
Valets can work in various hospitality settings (restaurants, hotels, resorts) and across industries such as automotive and travel.
See the industries with the highest number of Valets in the table below.
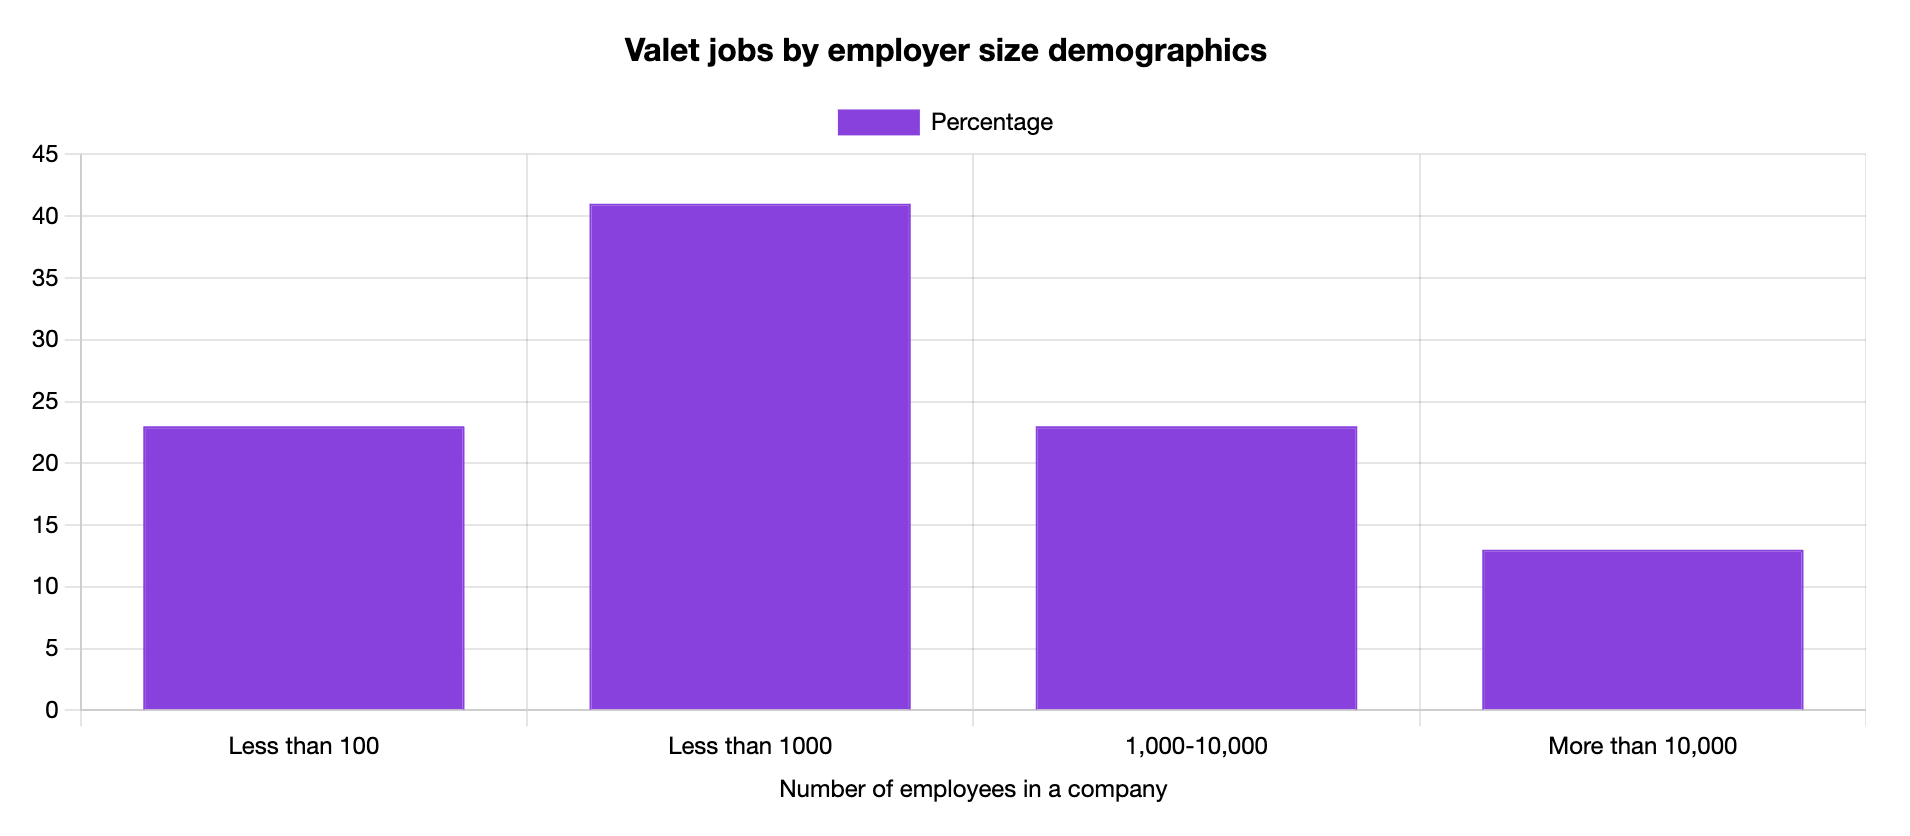
Valet Jobs by Company Size
Valets work for companies of all shapes and sizes.
To that end, 23% of all Valets work for companies that employ less than 100 people, while 23% of Valets work for companies with 1,000 to 10,000 employees.
See the breakdown of Valets by company size.
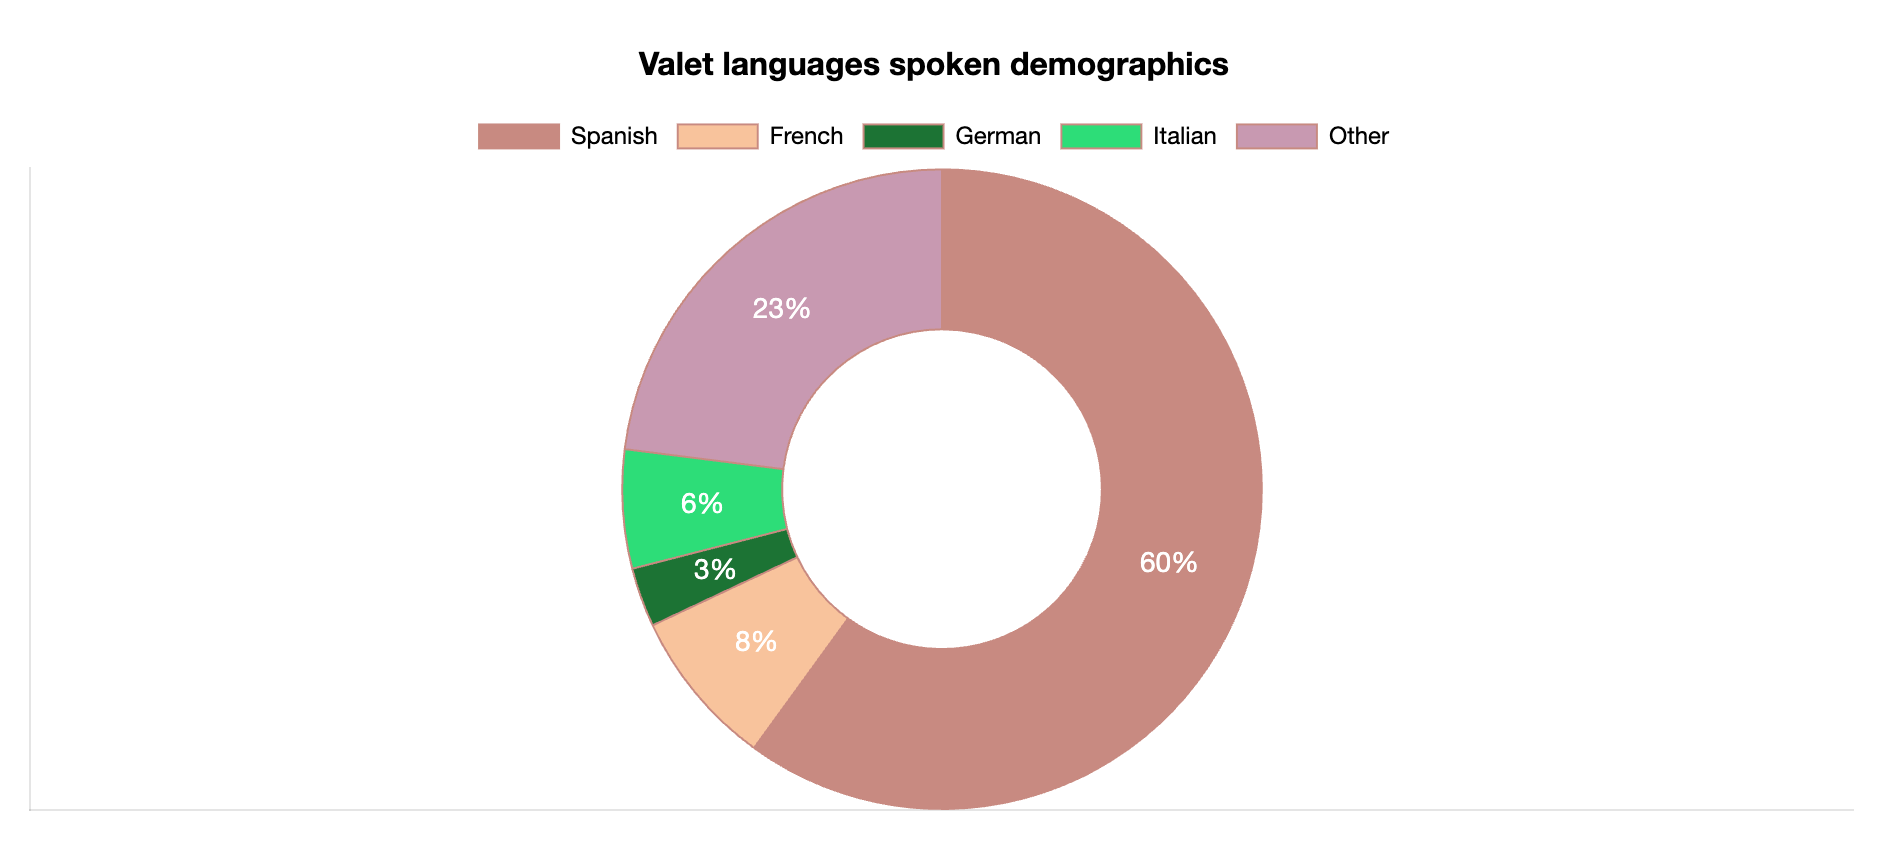
Valet Languages Spoken
Aside from English, many Valets also speak a number of other languages, including Spanish, Russian, German and more.
See the breakdown of which second languages Valets speak in the graph below.
Additional Valet Statistics
- More than 50% of all Valets are older than 40
- 19% of Valets are Hispanic or Latino
- 17% of all Valets have an associate's degree
- 30% of Valets work in companies that employ between 100 and 500 people
- Most Valets (60%) who know a second language speak Spanish
Valet Statistics and Demographics Data
We use government and agency resources to calculate our Valet statistics and demographics.
See how we do it on our statistics methodology page.

Reviewed by Stefan Petrov
With over 10 years of experience as a writer and editor, Stefan has worked in the automotive, IT, health and hospitality industries. Familiar with Google Search Console and other SEO tools like Ahrefs and Semrush, Stefan uses his experience to create content that's visually appealing to the user but also ranks in the SERPs.