20 Interesting Statistics About Private Chefs – 2026
In this article, we’ve got 20 awesome Private Chef demographics and statistics to give you a better insight into the role.
- 33% of Private Chefs in the United States find their job enjoyable
- The Private Chef market is expected to hit $19.65 billion by 2033
- America is one of the leading hubs for this role and has 25% of all Private Chef business in the world
- Depending on their expertise, some Private Chefs make $200 to $500 per day
- American Private Chefs make the least amount of money in Florida ($52,322 per year)
Private Chef Employment Statistics
It's difficult to determine how many Personal and Private Chefs are currently working in the United States since many are working part-time or full-time for one employer.
That being said, the number is estimated to be around 34,000 Private and Personal Chefs.
Since 2020, the Private Chef industry has recorded a steady rise in demand. It is expected that the numbers will continue to climb as a growing population increases the need for Private Chefs around the U.S.
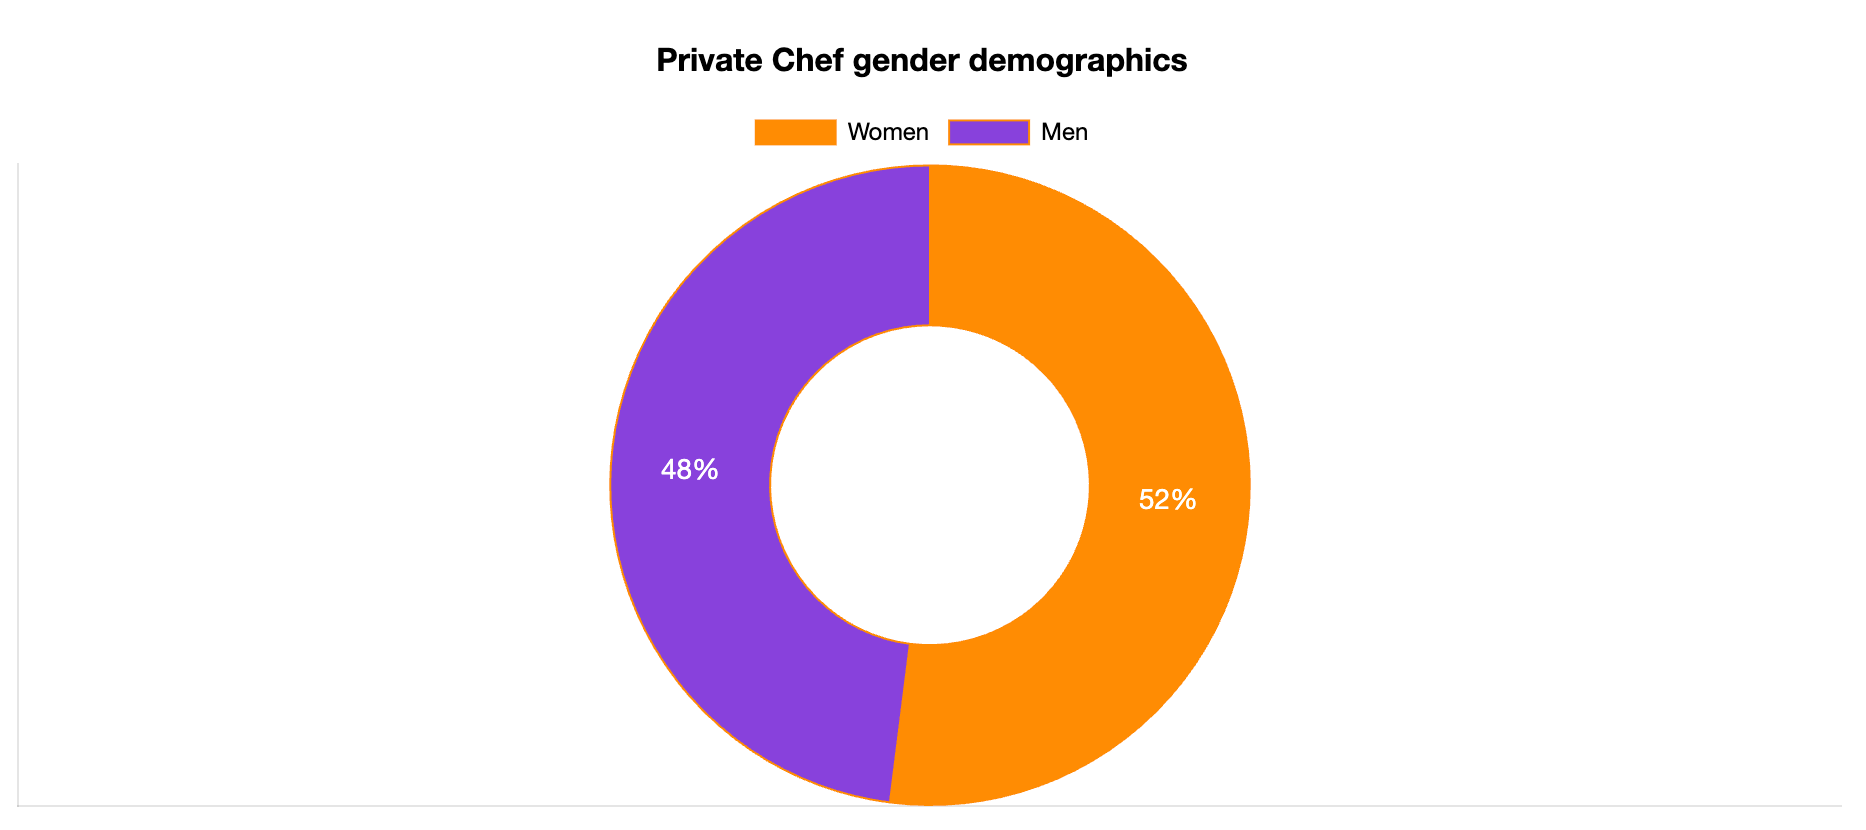
Private Chef Gender Statistics
Both women (52%) and men (48%) are equally eager to become Private Chefs. This is different from other Kitchen Roles which tend to be more male dominated. Learn more on our Executive Chef demographics page.
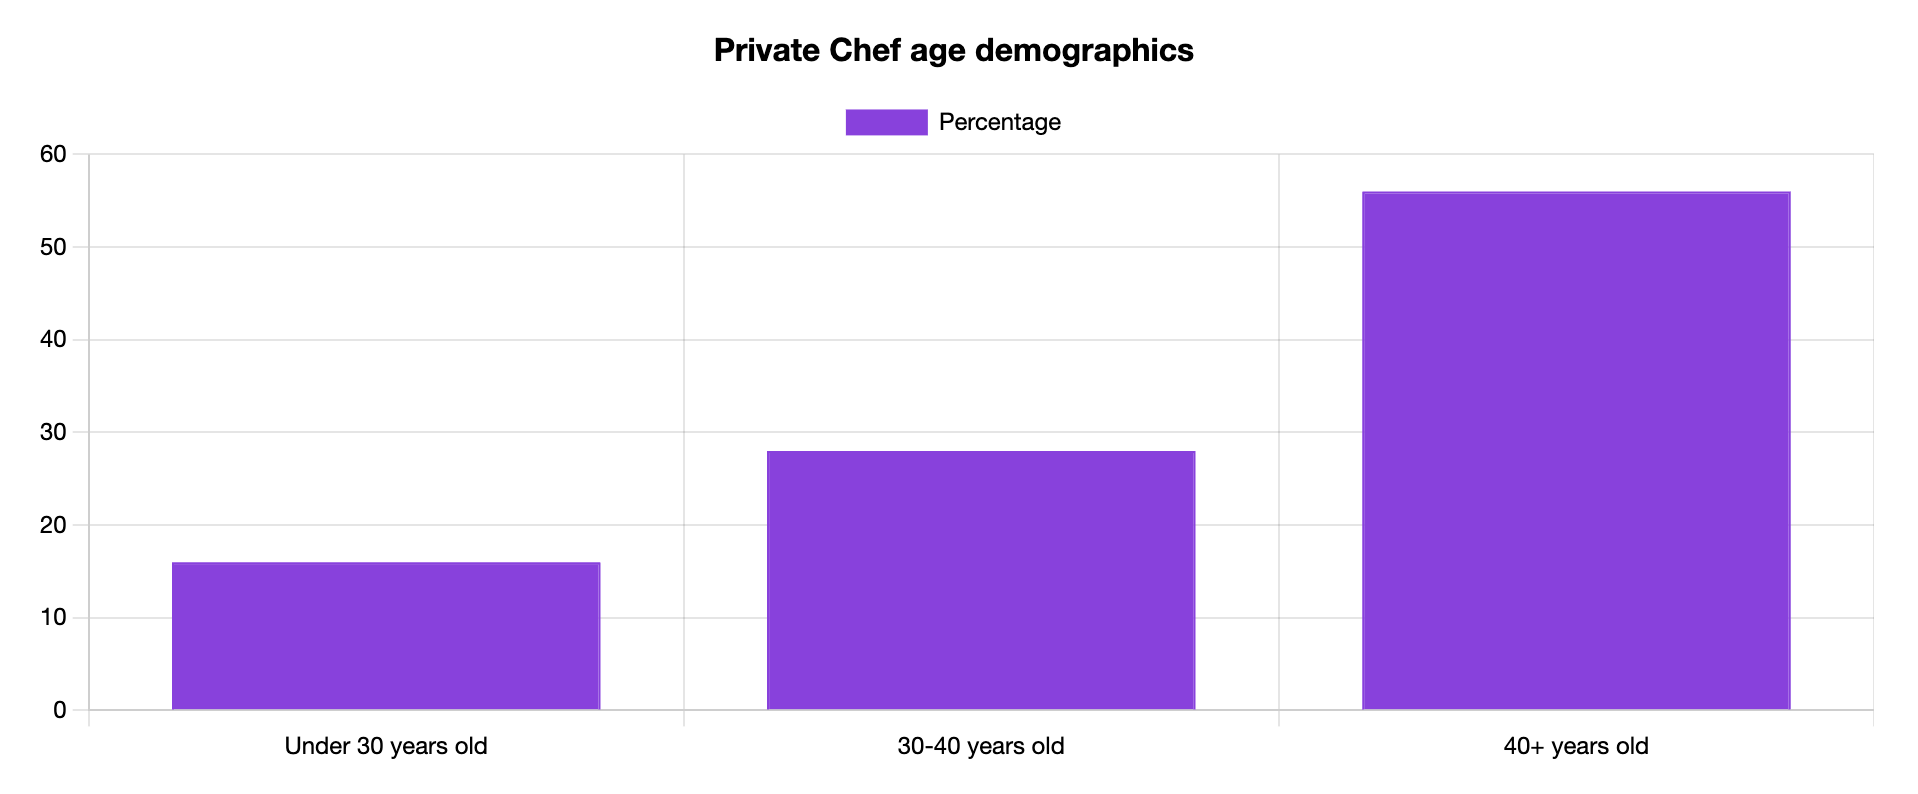
Private Chef Age Statistics
The majority of Private Chefs in the U.S. are over 40 years old (56%). This indicates that work experience is one of the most important aspects of being an excellent Chef.
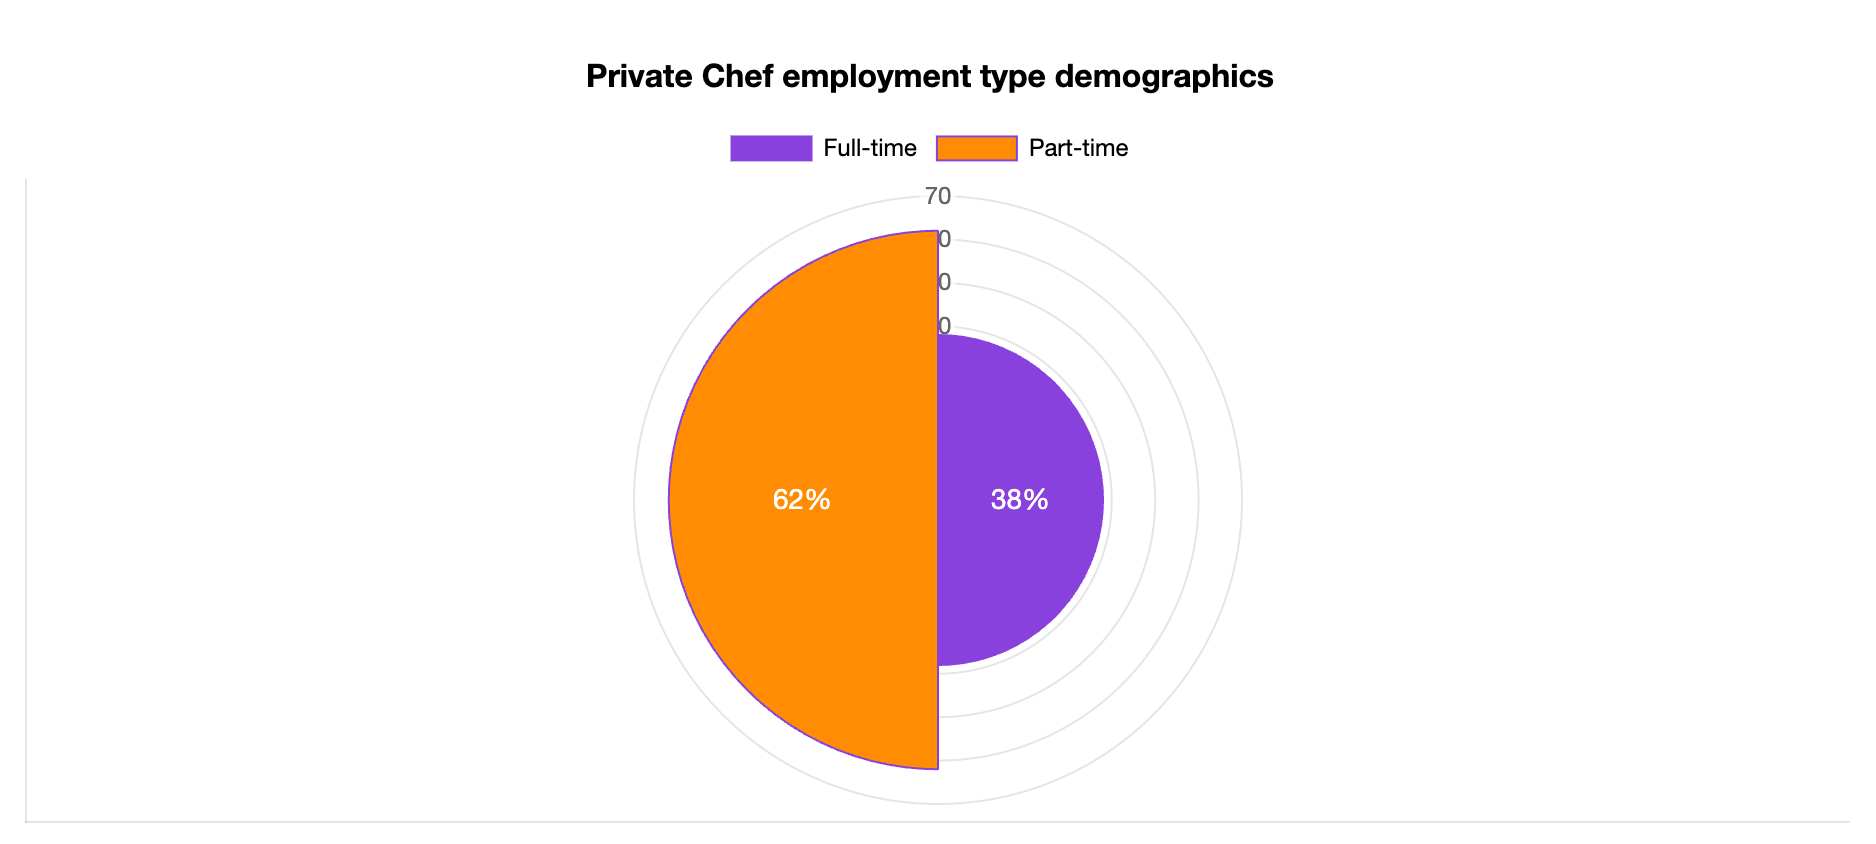
Private Chef Employment Type Statistics
Given how Private Chefs are usually hired for private events, most Chefs work part-time (62%), while only 38% are committed full-time.
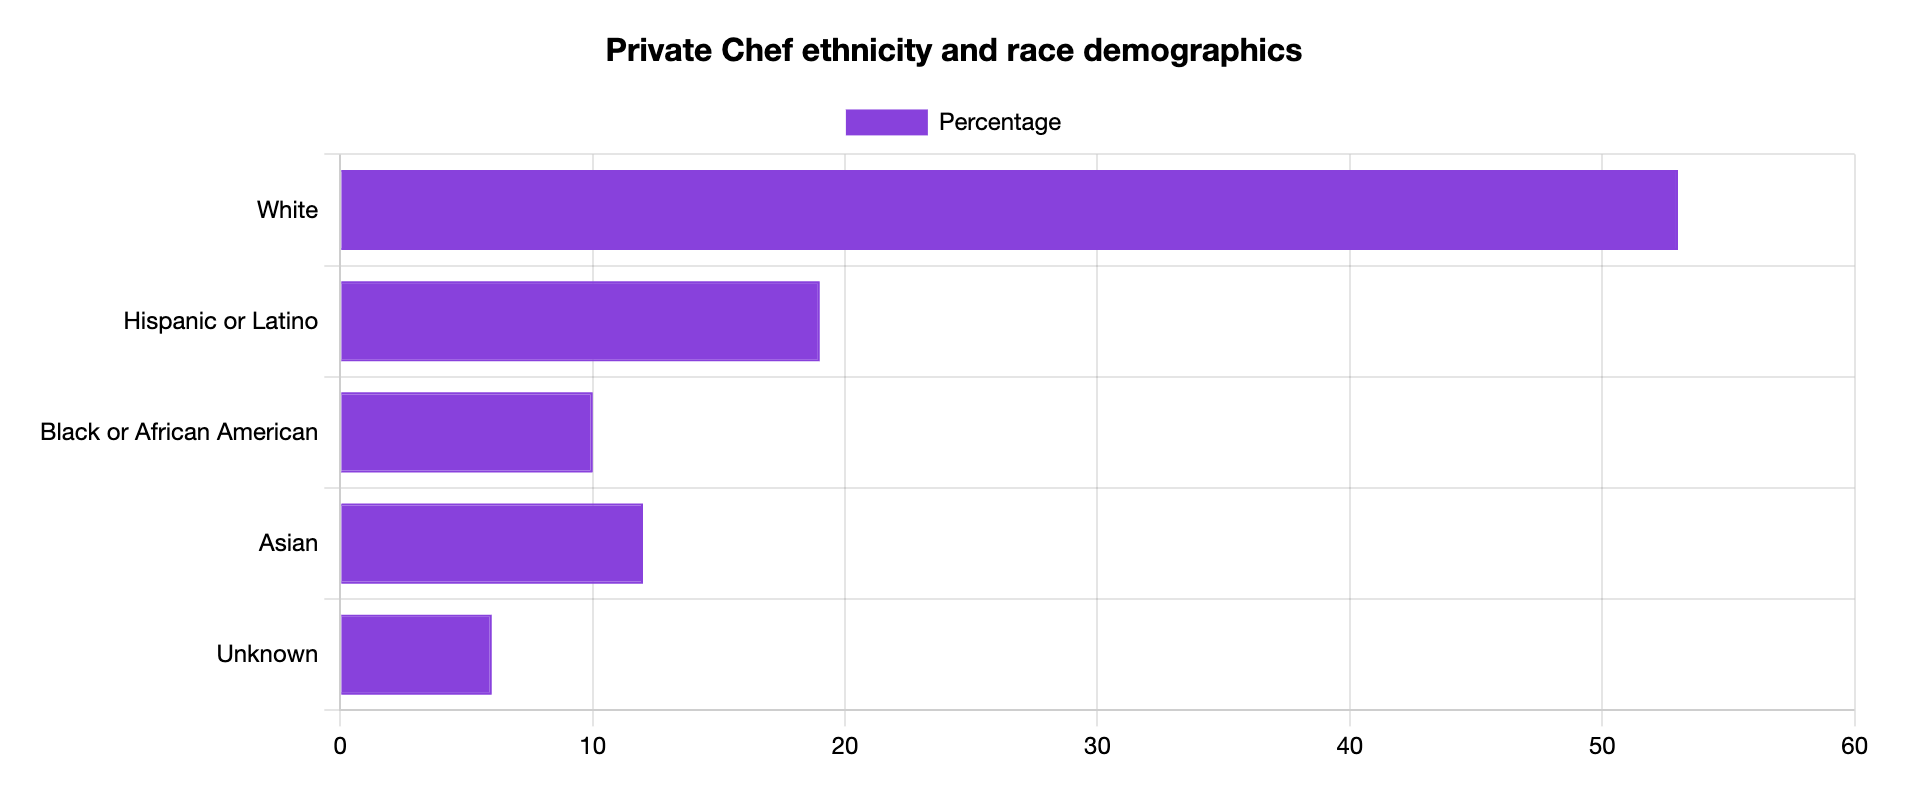
Private Chef Ethnicity and Race Statistics
An overwhelming majority of Private Chefs in the U.S. are white (53%). This is similar to other kitchen roles where the majority of workers are Caucasian. Learn more on our Sous Chef demographics page.
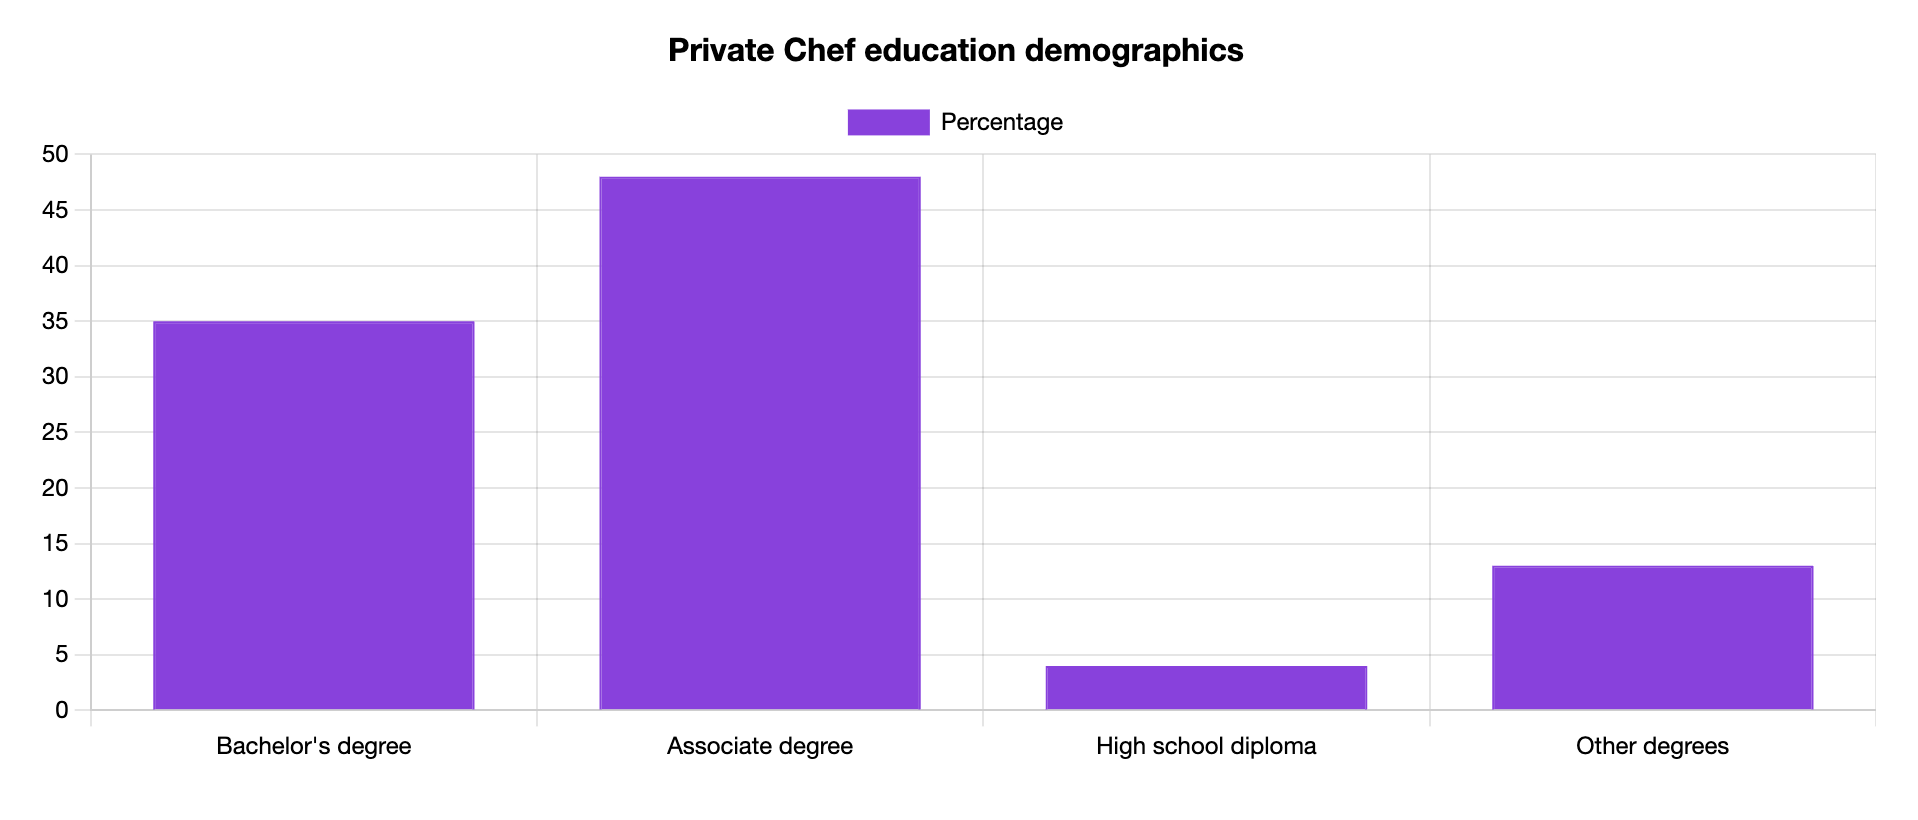
Private Chef Education Statistics
Most Private Chefs (83%) are college graduates due to job requirements that include extensive culinary training where they learn the ins and outs of cooking.
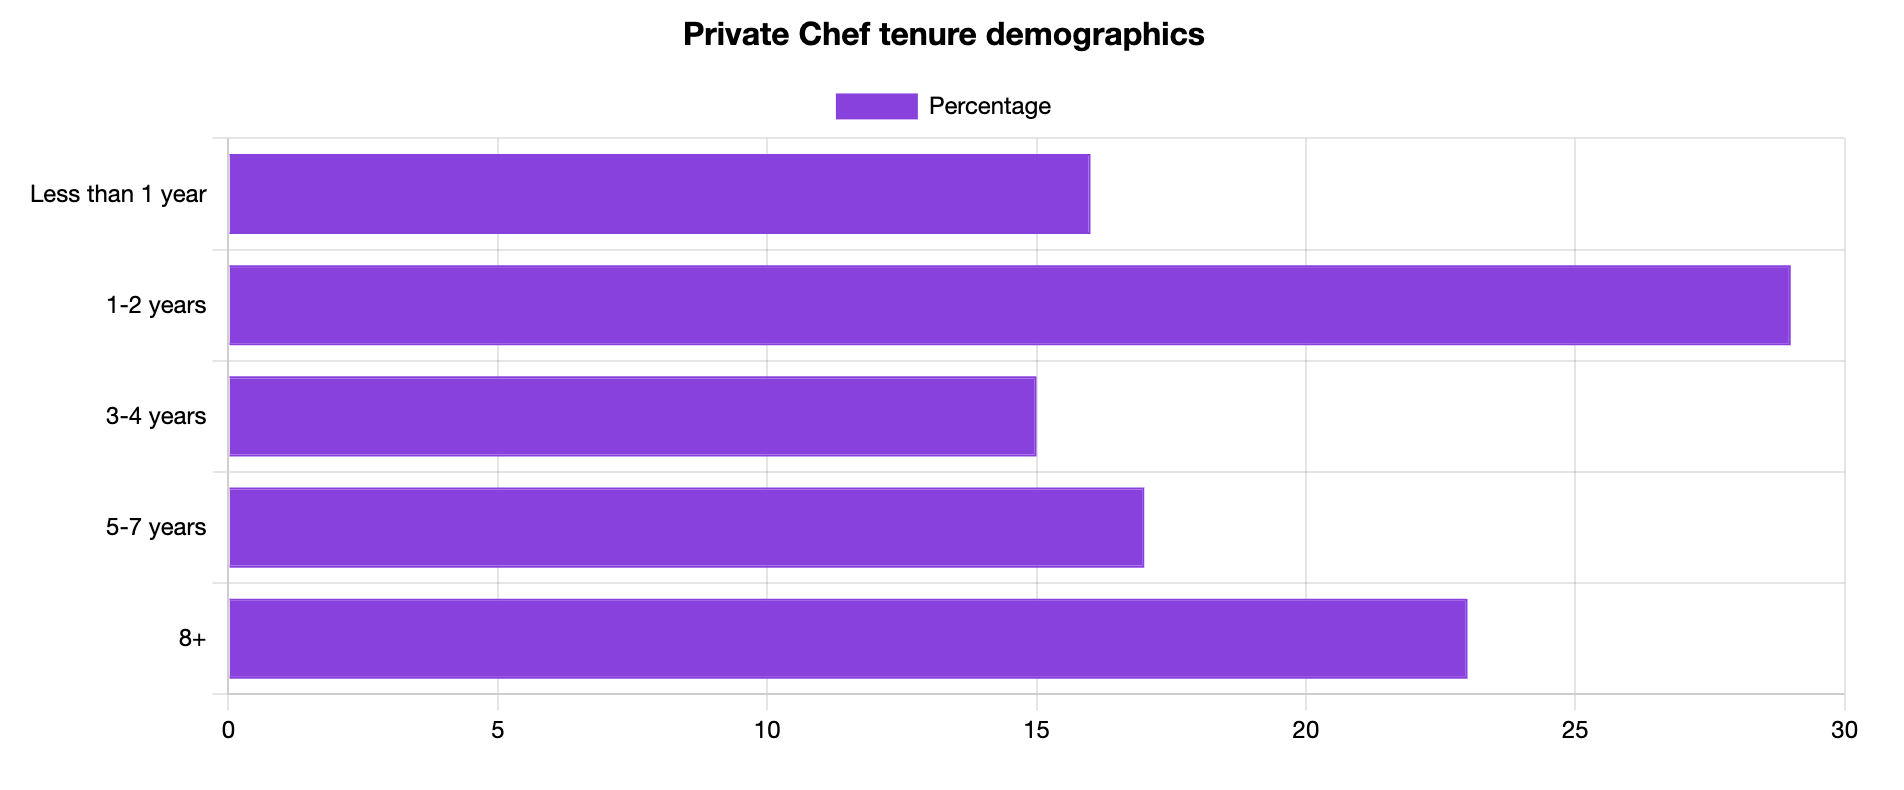
Private Chef Tenure Statistics
Typically, 29% of Private Chefs spend one to two years in their role.
Private Chef Jobs by Industry
According to the Bureau of Labor Statistics, Private Chefs are usually hired in nonprofit and charity sectors under religious organizations.
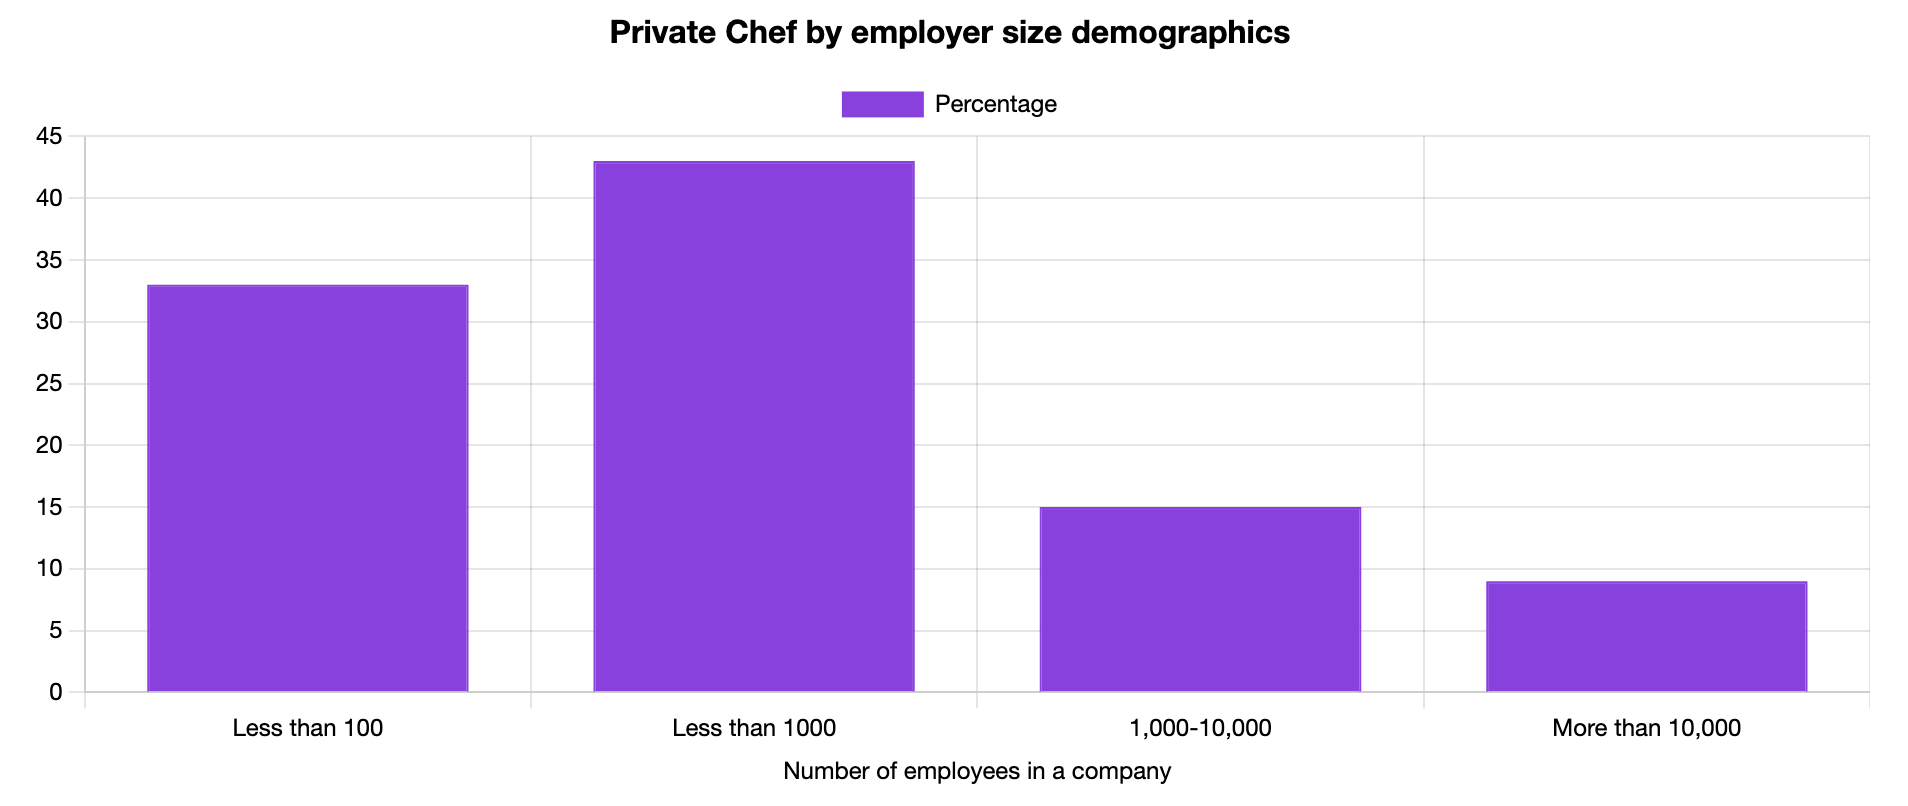
Private Chef Jobs by Company Size Statistics
The majority of Private Chefs (76%) work in companies that hire less than 1,000 employees.
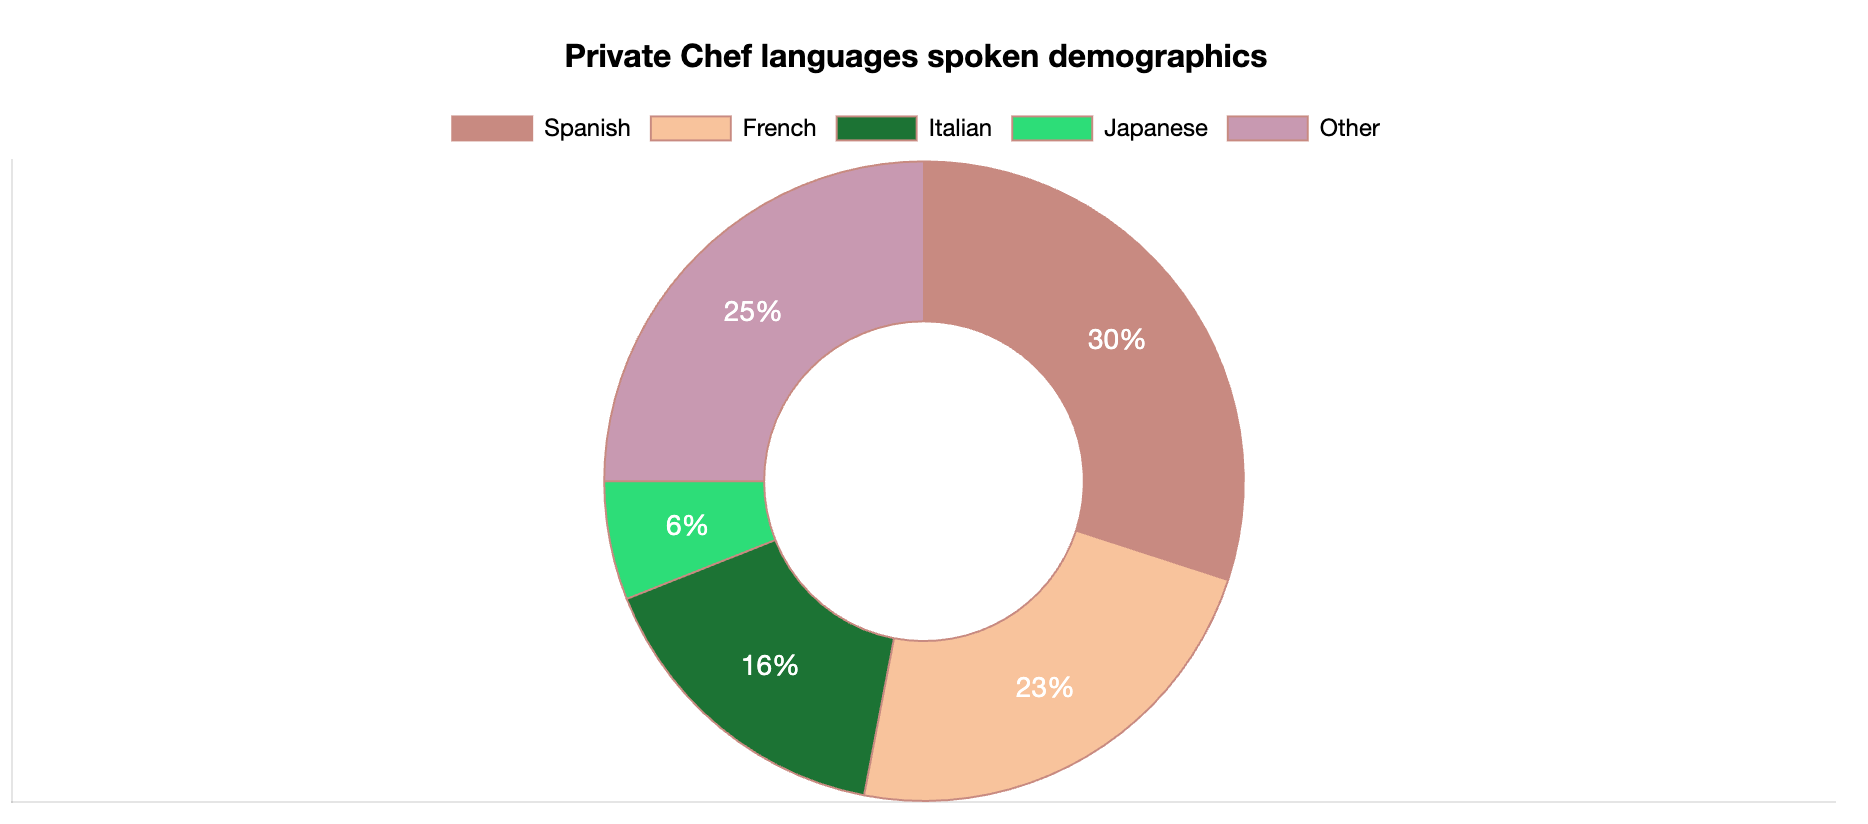
Private Chef Languages Spoken
While many Private Chefs come from diverse backgrounds, there are three dominant languages in the industry — Spanish (30%), French (23%) and Italian (16%).
This language breakdown aligns with other hospitality roles in which Spanish is the most popular second language – see more on our Pastry Chef demographics page.
5 More Private Chefs Stats
- Only 1% of Private Chefs are working in the automotive and insurance industry
- Around 60% of New York’s Private Chefs move to the Hamptons during the summer
- 69% of Private Chefs prefer working for a private company
- Even though Chefs charge premium rates, it’s still common to tip them 10-20%
- When cooking for wealthy clientele, some dishes can cost as much as $1,000
Private Chef Statistics and Demographics Data
We’ve gathered the data using our unique statistics method that we’re constantly fine-tuning to provide accurate and relevant information for hospitality careers.

Reviewed by Stefan Petrov
With over 10 years of experience as a writer and editor, Stefan has worked in the automotive, IT, health and hospitality industries. Familiar with Google Search Console and other SEO tools like Ahrefs and Semrush, Stefan uses his experience to create content that's visually appealing to the user but also ranks in the SERPs.