Pastry Chef Demographics and Statistics in the US – 2026
We’ve created a list of common Pastry Chef statistics and demographics in the United States.
Keep reading to learn how long they stay at the same employer, how educated they are and how many are women.
- The average salary of a Pastry Chef in the U.S. is $54,995 per year
- If you’re a Pastry Chef in New York, you can expect to earn $63,099 per year on average
- The average Pastry Chef salary in Miami is $54,714 per year
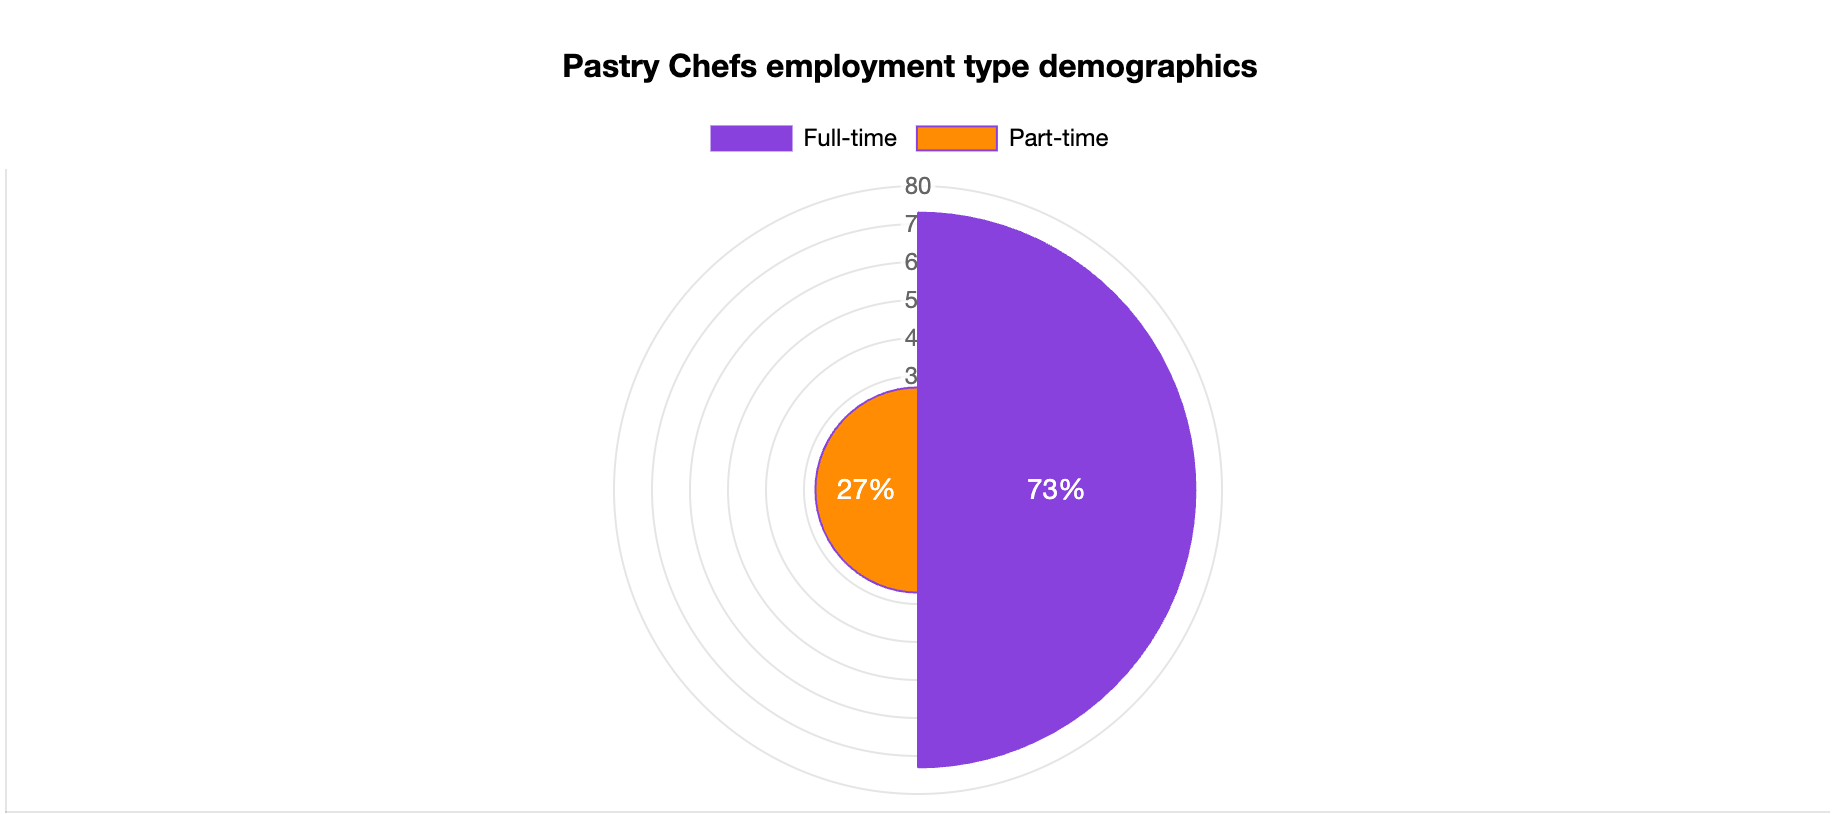
- 73% of Pastry Chefs work full-time
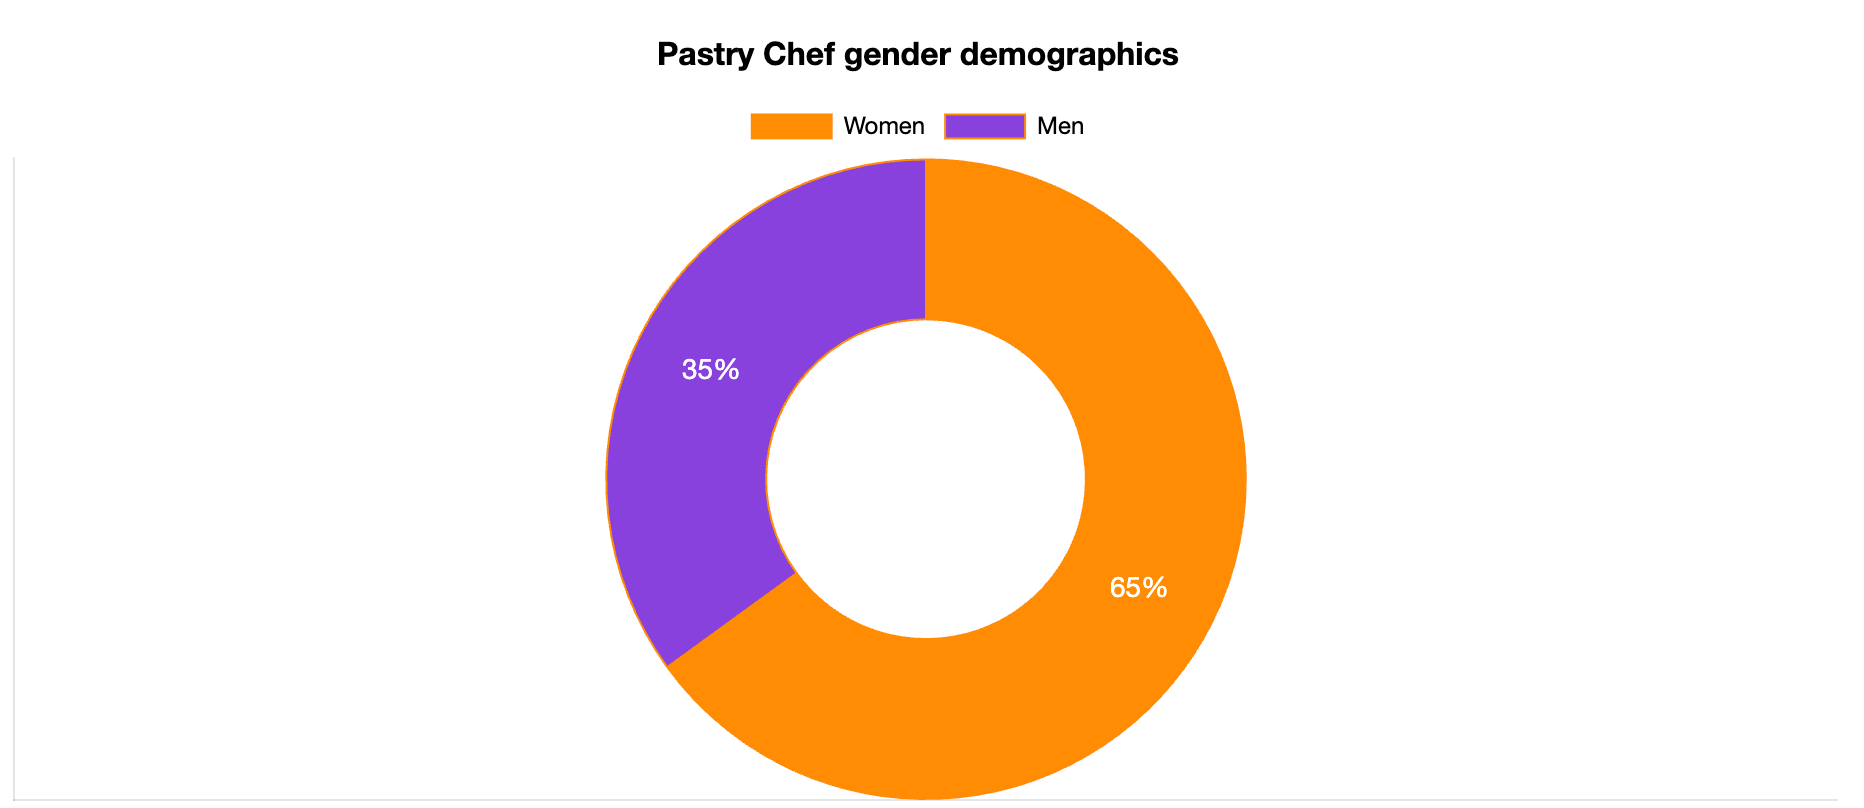
- 35% of Pastry Chefs are men
Pastry Chef Employment Statistics
There are more than 105,000 individuals working as Pastry Chefs in the United States. This number is similar to the number of Head Chefs as you can learn on our Head Chef demographics page.
Pastry Chef Gender Statistics
Women comprise the majority of Pastry Chefs (65%).
Pastry Chef Employment Type Statistics
27% of Pastry Chefs work part-time.
Pastry Chef Age Statistics
Most Pastry Chefs are older than 40 years, followed by 28% of them who are between 20 and 30 years old.
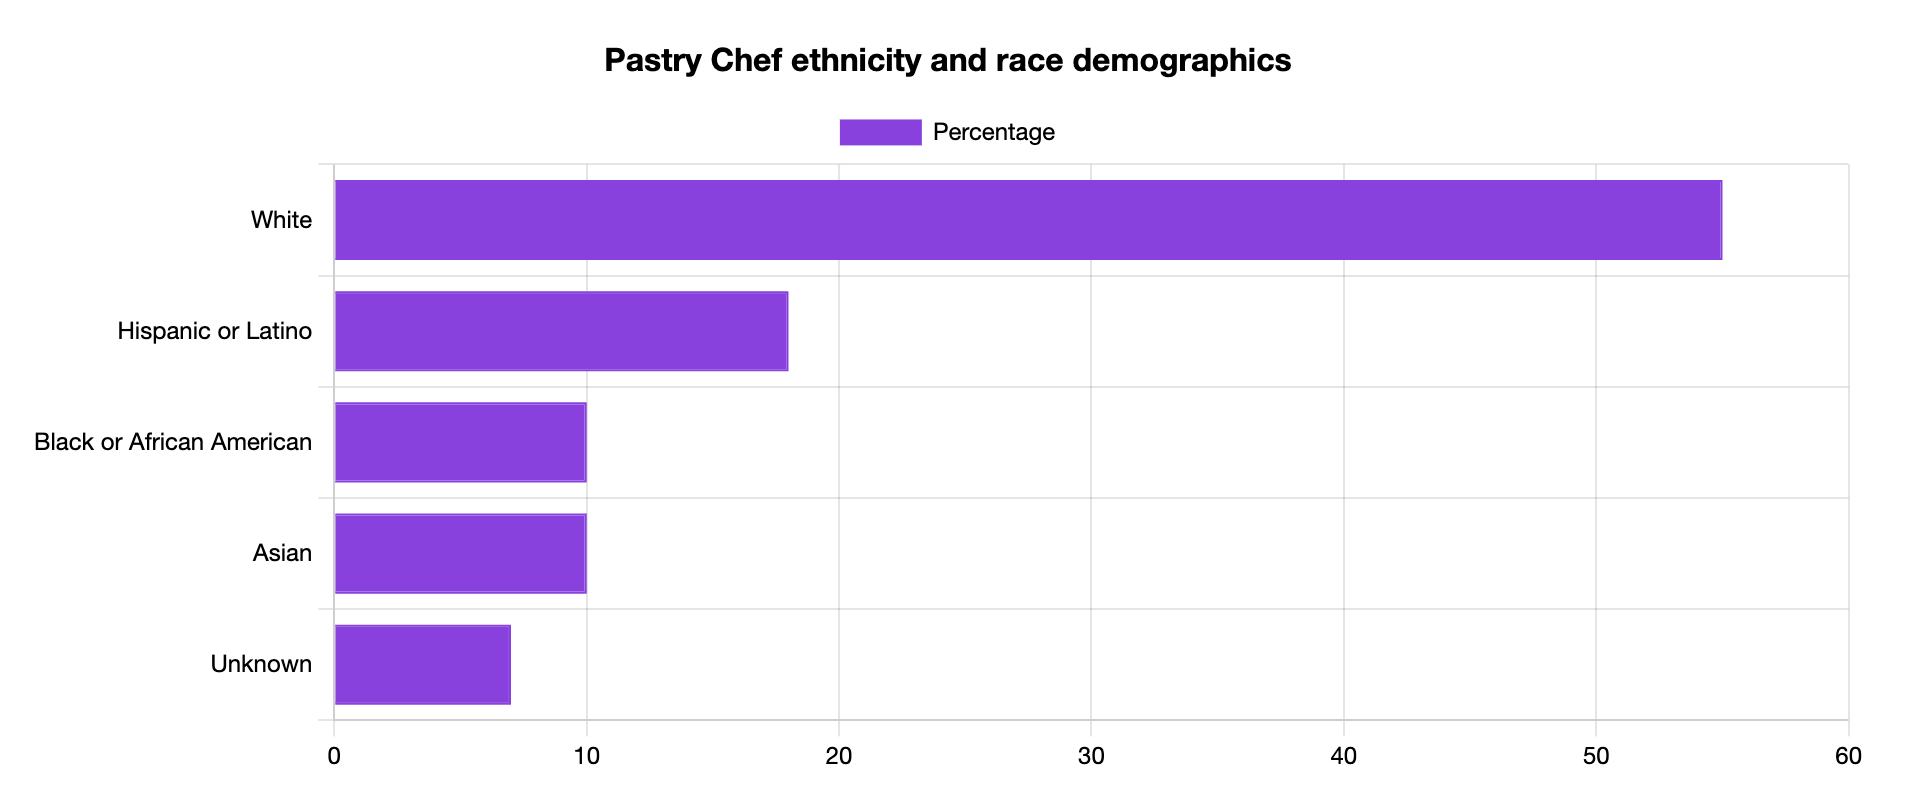
Pastry Chef Ethnicity and Race Statistics
Most Pastry Chefs are white, followed by Hispanic or Latino (18%) and Asian (10%) Pastry Chefs.
This breakdown based on ethnicity and race is similar to other hospitality roles, as you can see on our Sushi Chef demographics page.
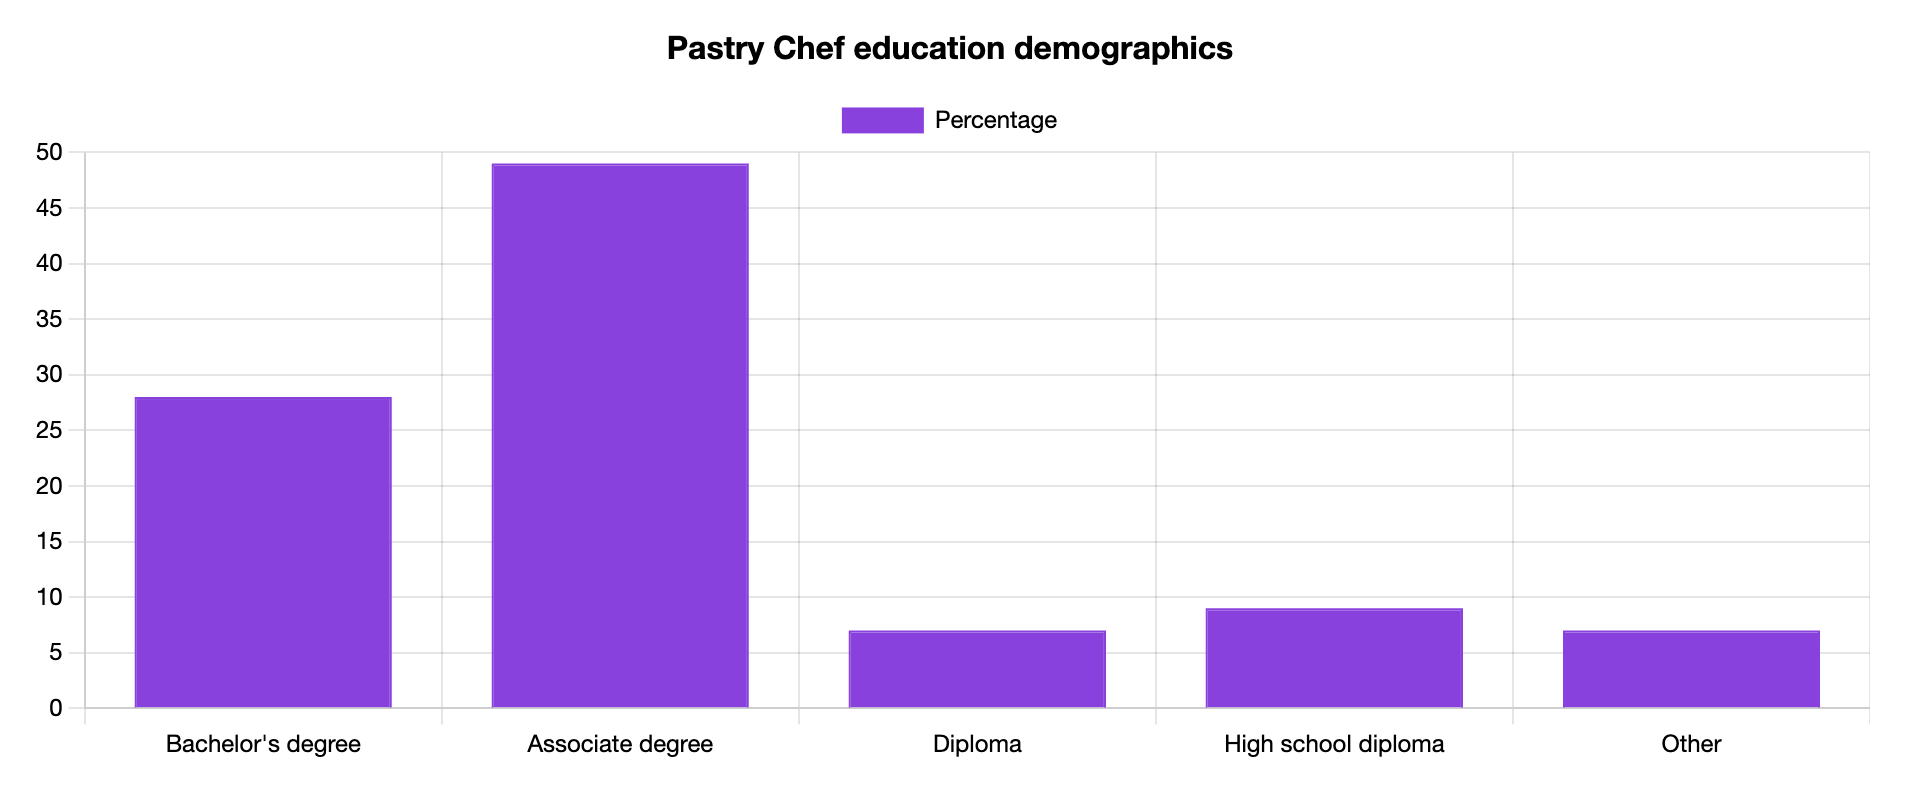
Pastry Chefs Education Statistics
You don’t need extensive education to become a Pastry Chef. Most employers are looking for a combination of skills and experience, so having extensive culinary education is not a requirement, although it might help your odds against the competition.
That said, most Pastry Chefs have an associate’s degree, while some (28%) have a bachelor’s degree.
Another kitchen role in which individuals don't have extensive education is the Line Cook. Explore our Line Cook demographics to learn more.
Pastry Chef Tenure Statistics
The hospitality industry has a high turnover rate which explains why most Pastry Chefs stay with the same employer for one (28%) or two (39%) years.
See how long Pastry Chefs stay at the same job below.

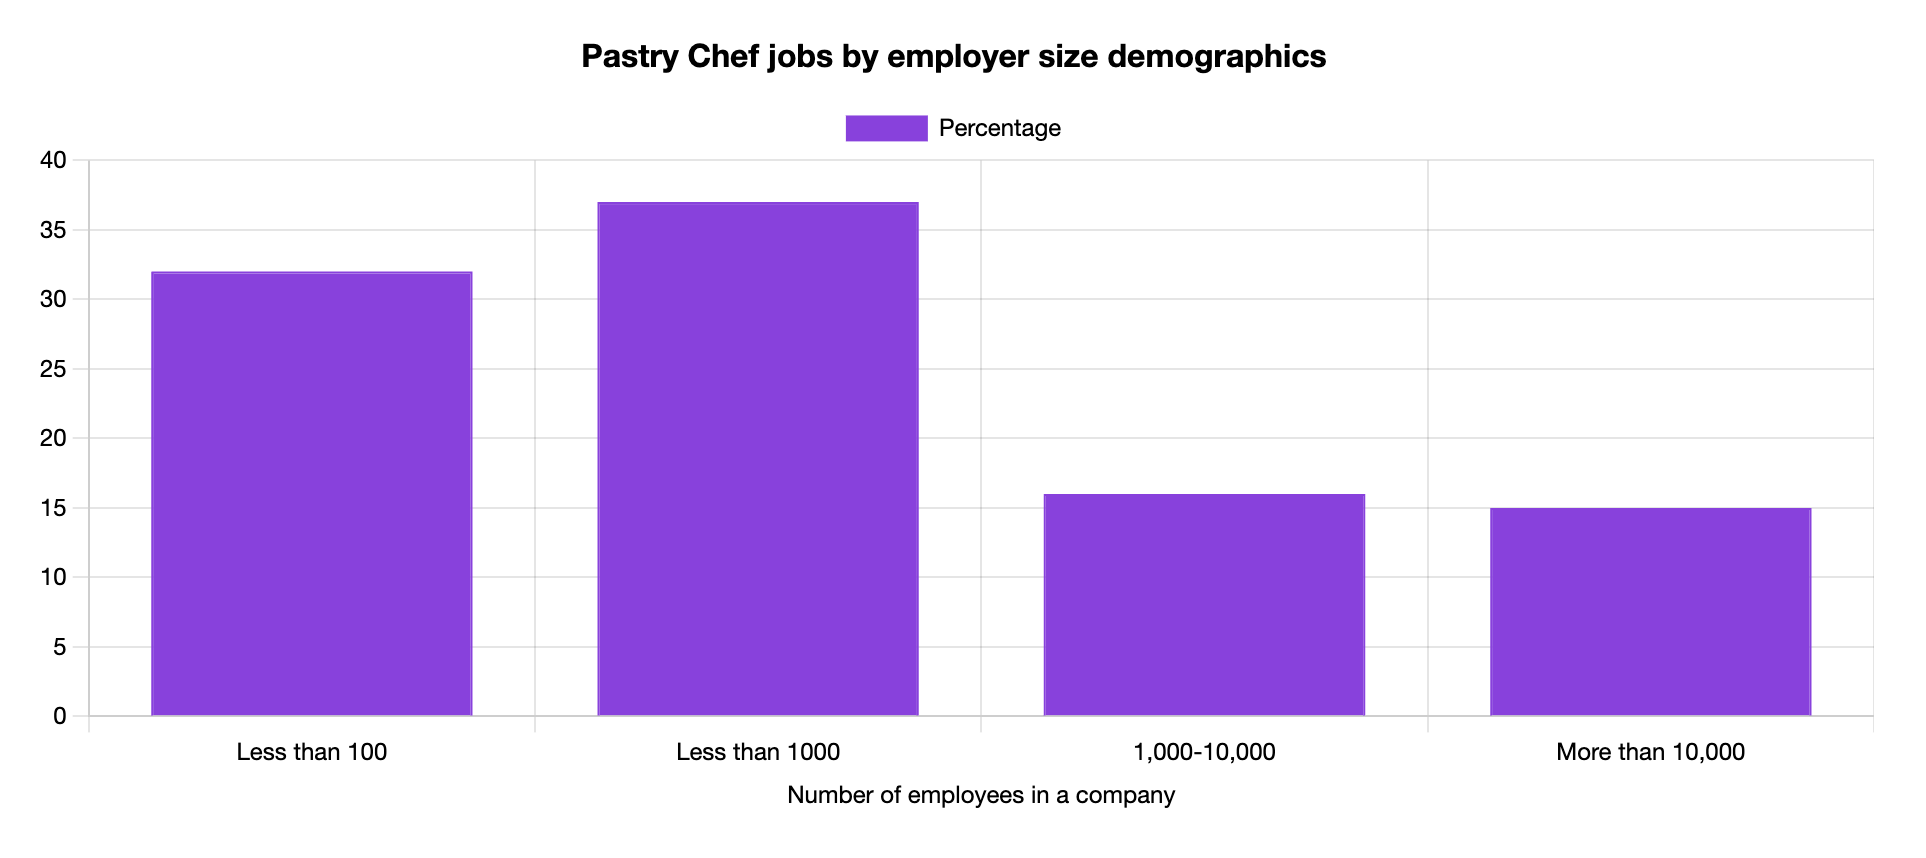
Pastry Chef Jobs by Company Size
Pastry Chefs work for various employers across eating establishments.
That means that the size of their employers significantly varies.
While most Pastry Chefs (37%) work for companies that employ between 1,000 and 10,000 people, 32% of them work in companies that have less than 100 employees.
See the breakdown of Pastry Chefs by company size below.
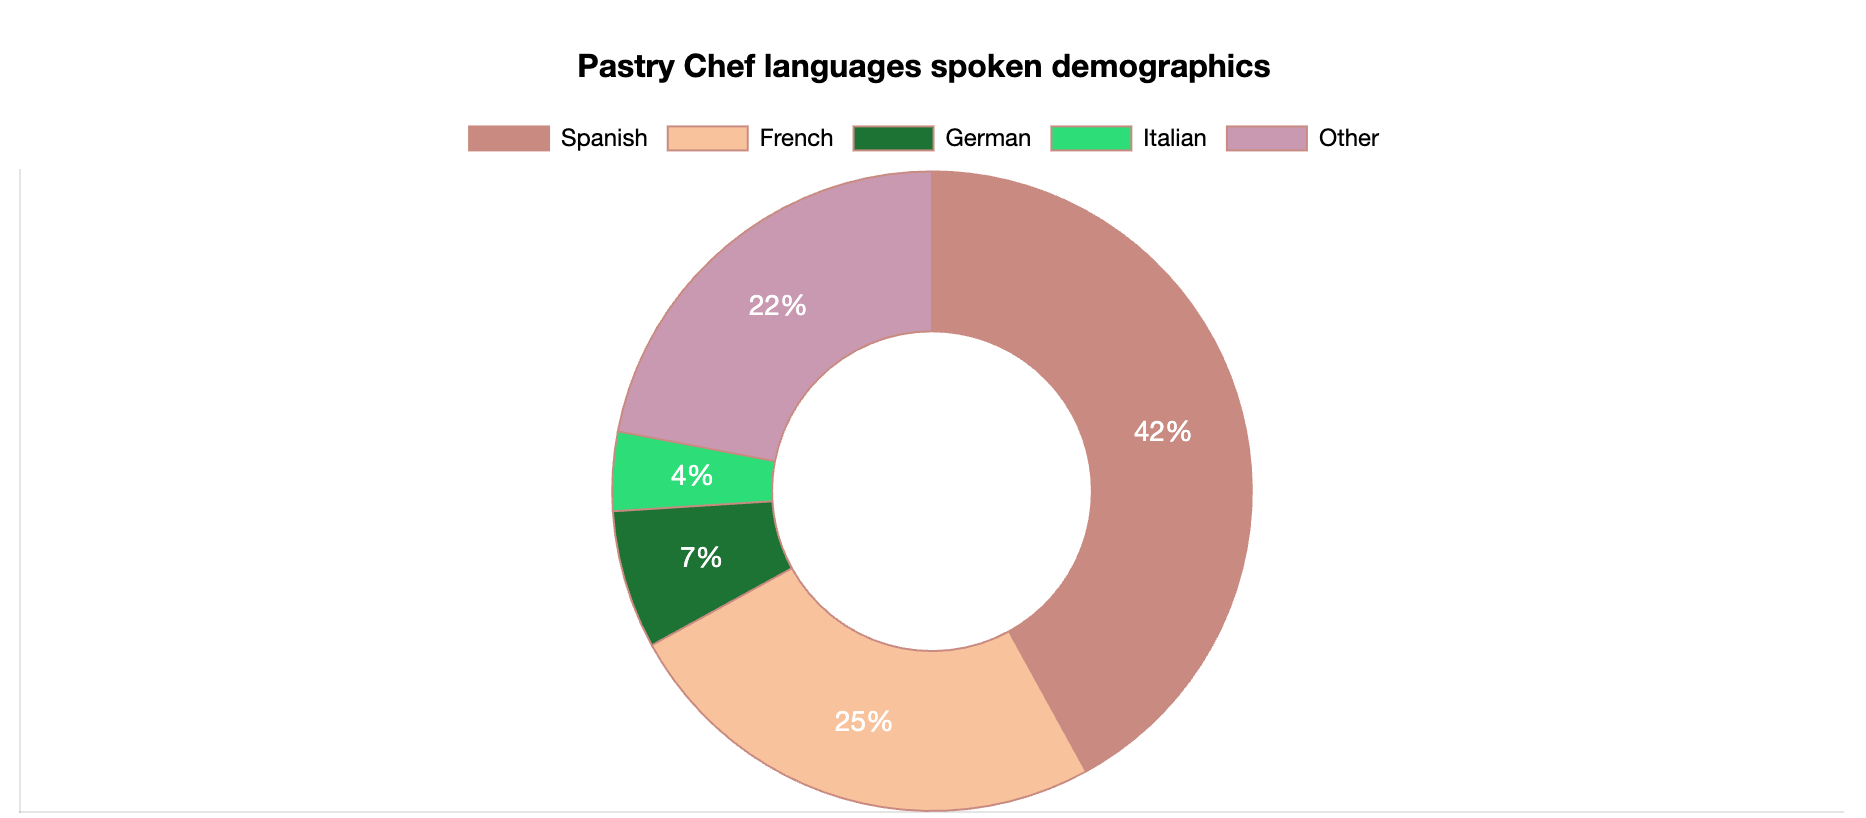
Pastry Chef Languages Spoken Statistics
While English is the first language for Pastry Chefs in the United States, a lot of them speak a second language.
In fact, Spanish is the most popular second language for Chefs with more 42% of them speaking it. However, Pastry Chefs also speak French, Italian and German.
See the second language most Pastry Chefs speak below.
Additional Pastry Chef Demographics
- 56% of Pastry Chefs are older than 40 years
- 55% of Pastry Chefs are white
- Most Pastry Chefs (49%) have an associate’s degree
- 39% of Pastry Chefs stay with the same employer for up to two years
- Washington offers the highest salaries for Pastry Chefs ($60,555)
Pastry Chef Statistics and Demographics Data
We collect our data from multiple sources.
To see how we collected Pastry Chef demographics and demographics, explore our statistics and demographics methodology page.

Reviewed by Stefan Petrov
With over 10 years of experience as a writer and editor, Stefan has worked in the automotive, IT, health and hospitality industries. Familiar with Google Search Console and other SEO tools like Ahrefs and Semrush, Stefan uses his experience to create content that's visually appealing to the user but also ranks in the SERPs.