Executive Chef Demographics and Statistics in the US – 2026
We created the article below to help you learn about statistics and demographics related to the Executive Chef role.
Read on to learn about where they work, what languages they speak, how many are women and more.
- The average Executive Chef's salary in the U.S. is $80,040 per year
- The median Executive Chef salary in NYC is $104,902 per annum
- The yearly salary of Executive Chefs in Miami is $89,396 on average
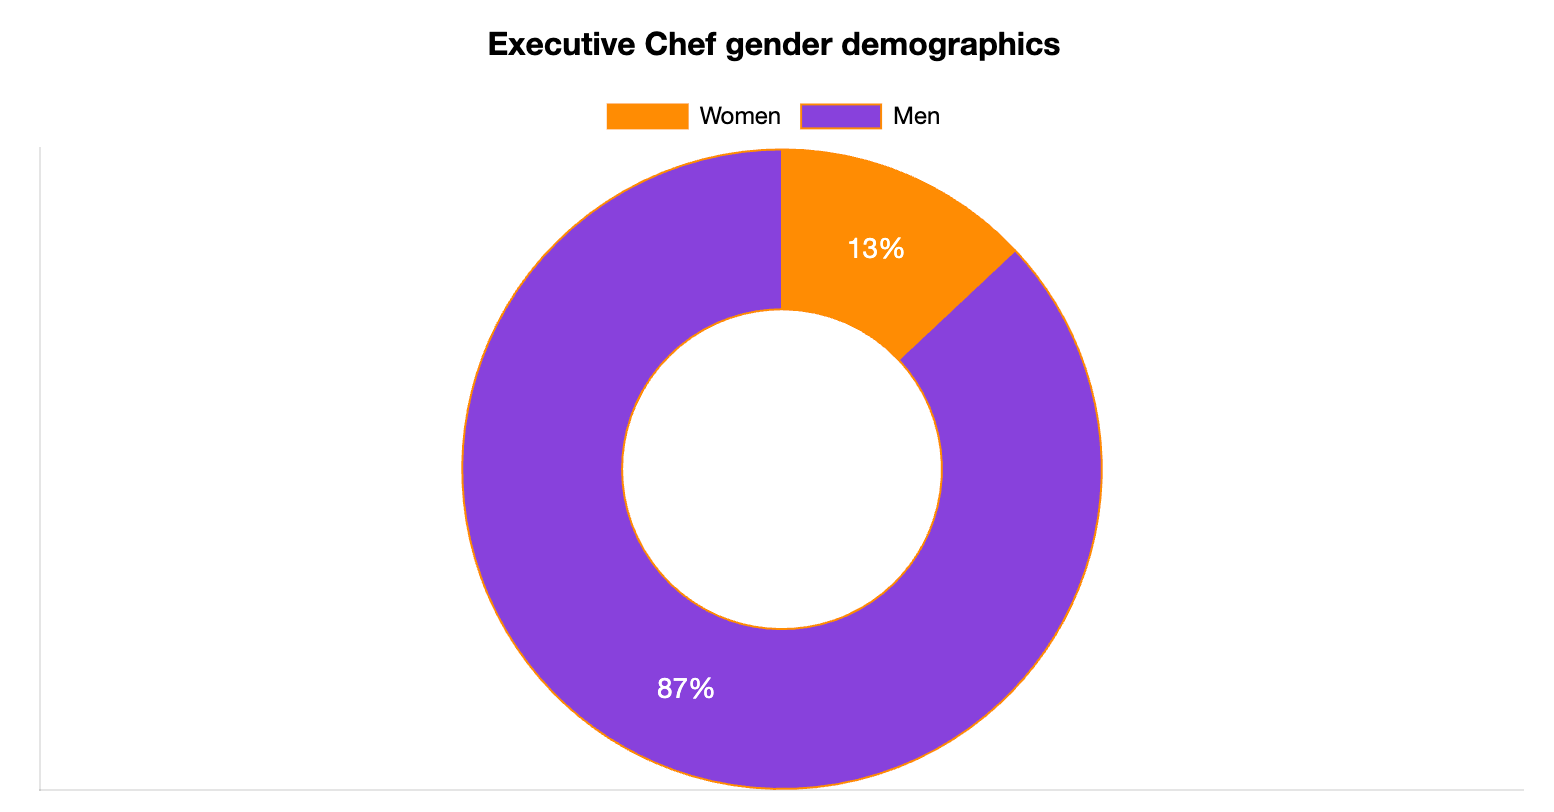
- 13% of Executive Chefs are women
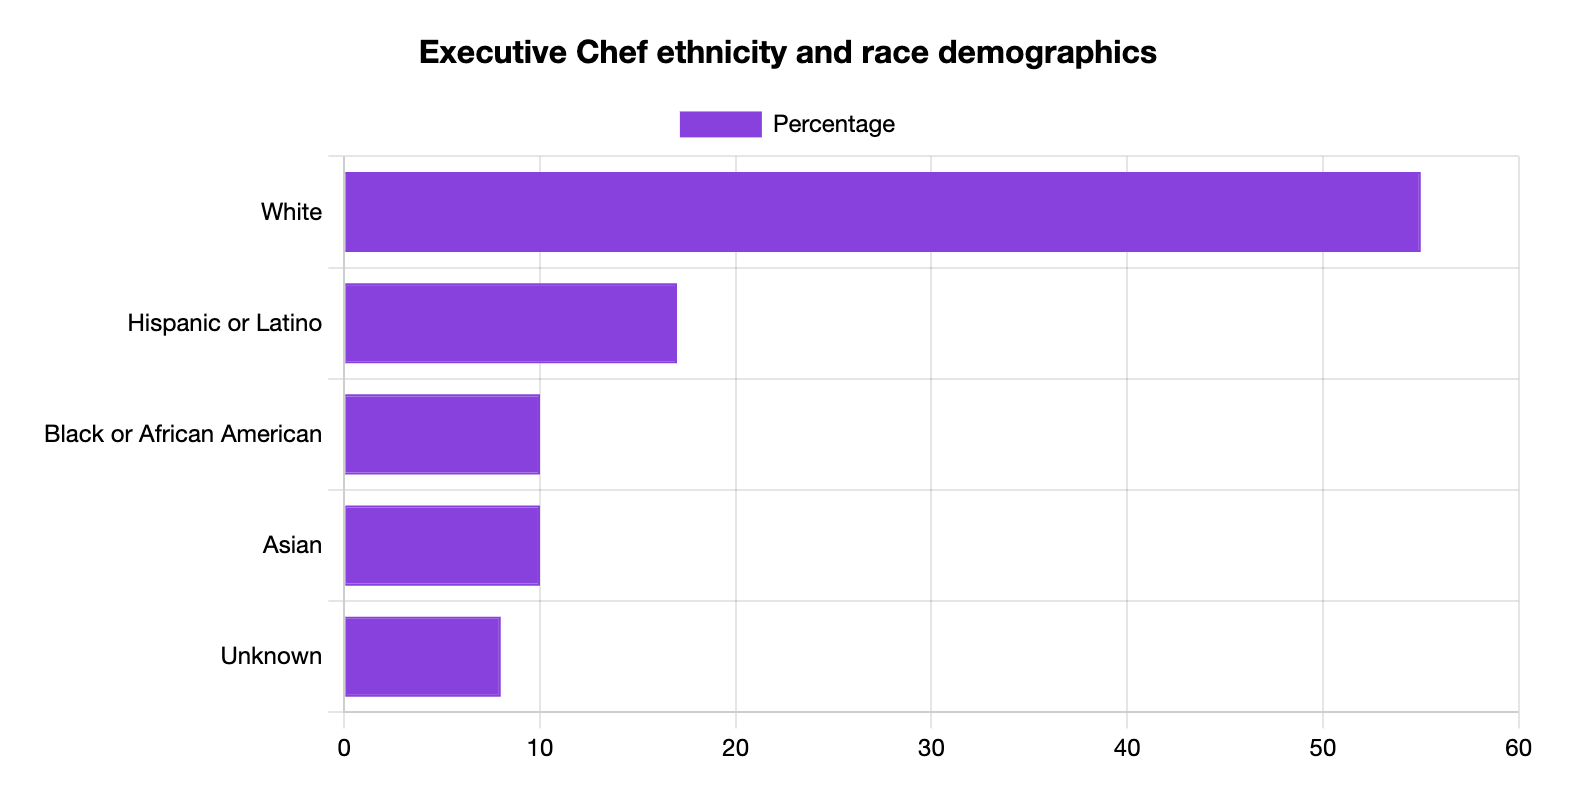
- 17% of Executive Chefs are Hispanic or Latino
Executive Chef Employment Statistics
There are 137,000 Executive Chefs working in the U.S.

Executive Chef Gender Statistics
87% of Executive Chefs are men, indicating a wide gap discrepancy in this role. This is similar to the Sous Chef demographics in the U.S.
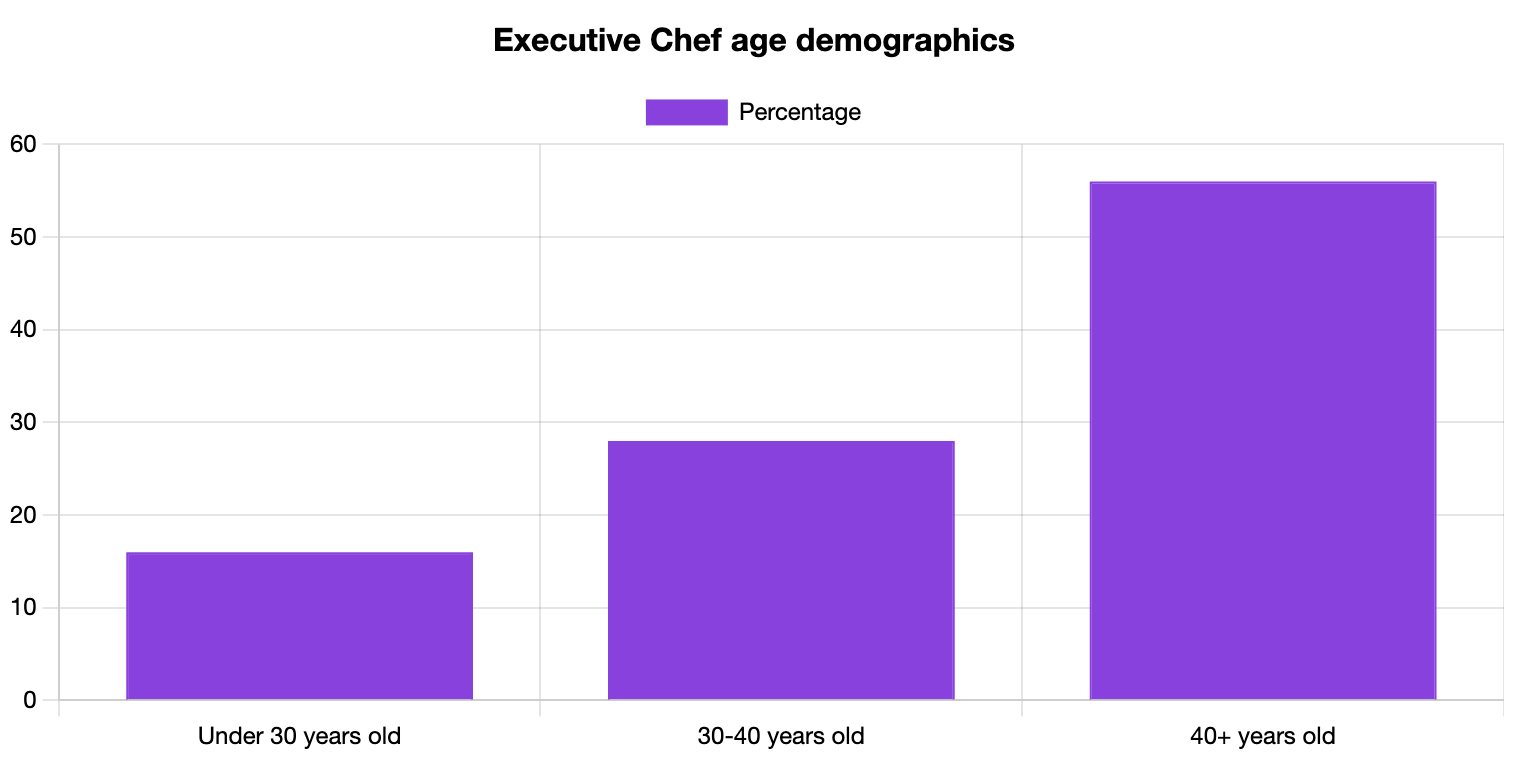
Executive Chef Age Statistics
More than half of all Executive Chefs are older than 40 years (56%), indicating that this position requires extensive experience and determination.
Executive Chef Ethnicity and Race Statistics
Most Executive Chefs are white (56%). This is similar to other hospitality roles, such as the demographics of Head Chefs.
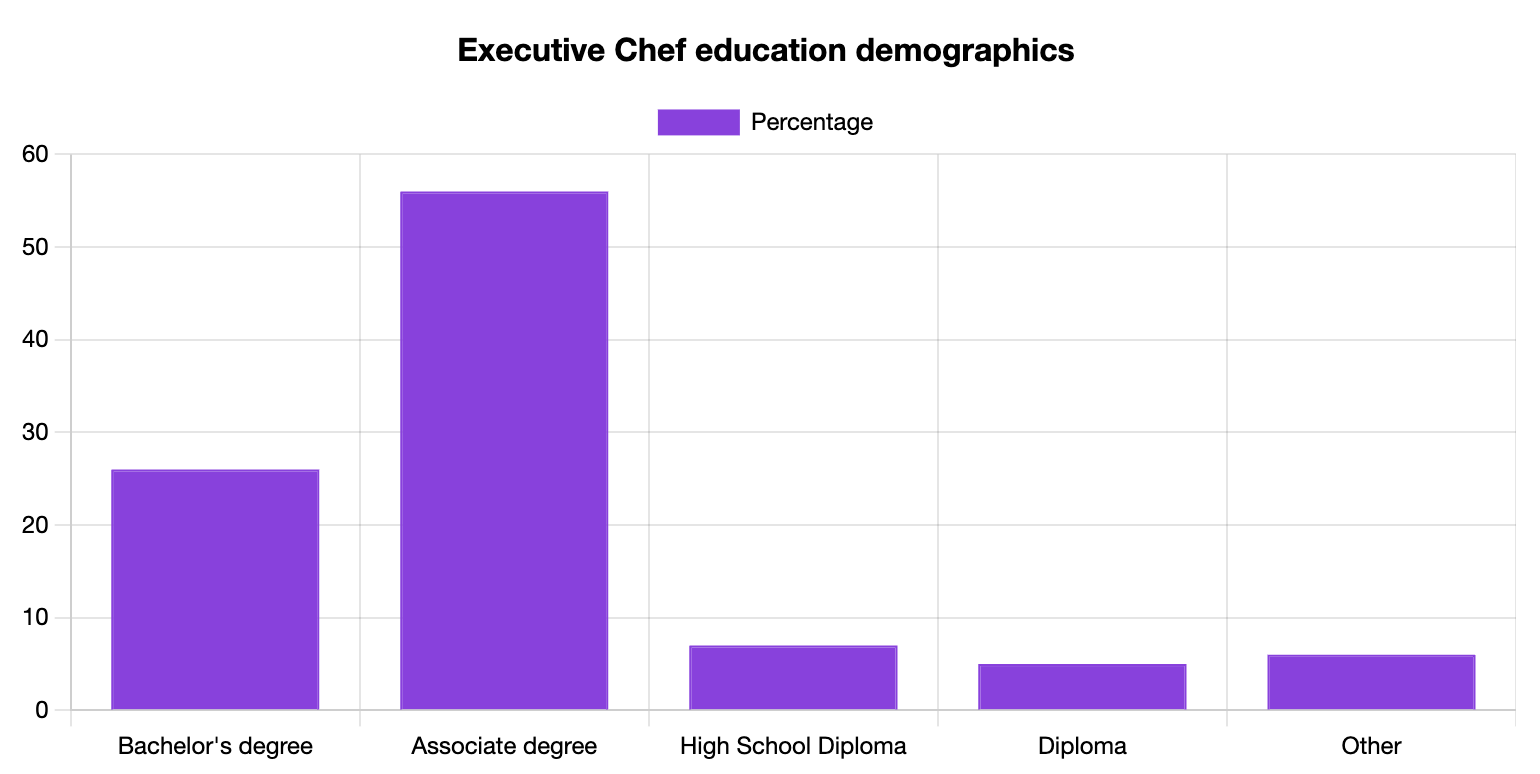
Executive Chef Education Statistics
26% of Executive Chefs have a bachelor’s degree.
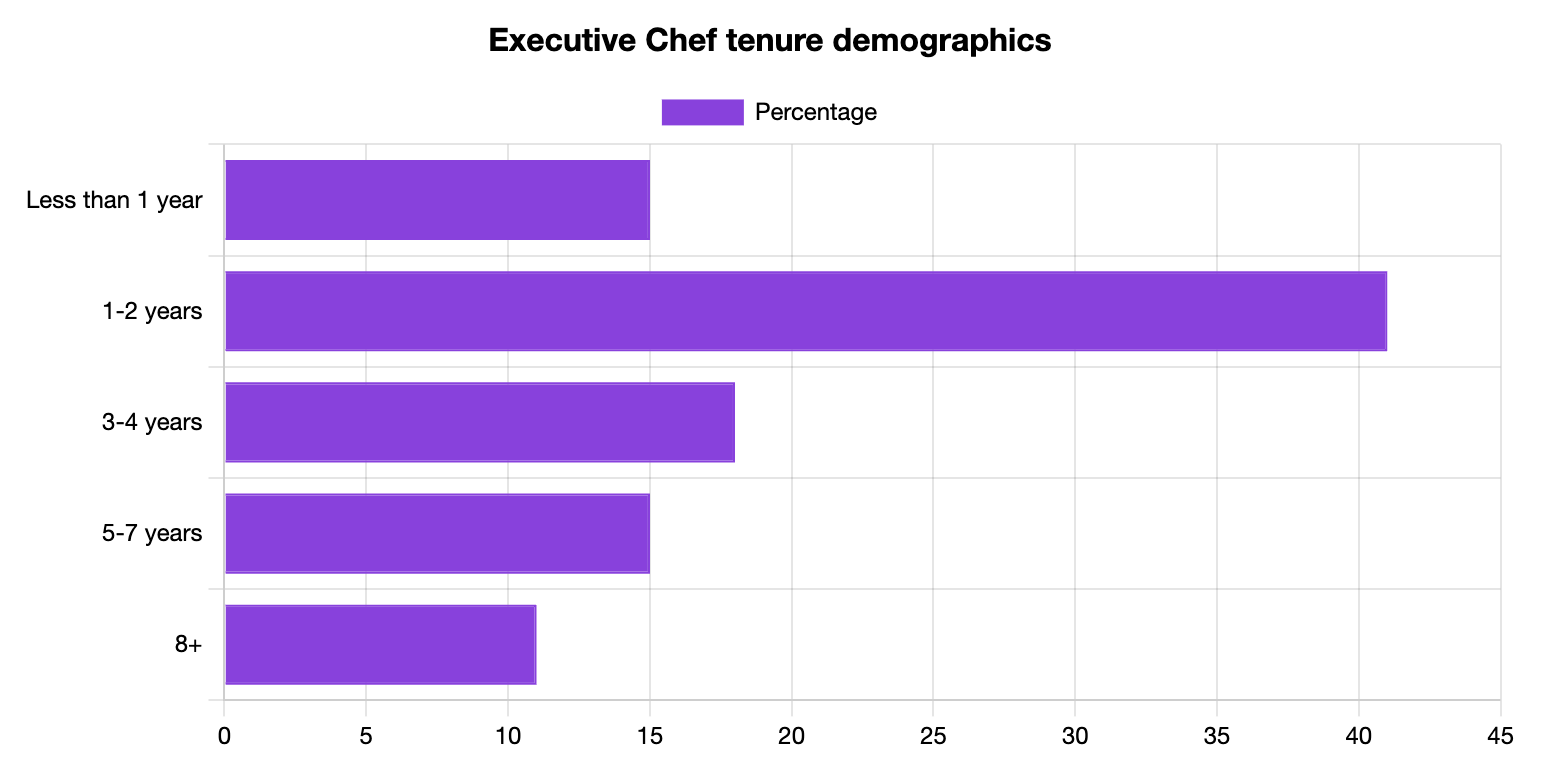
Executive Chef Tenure Statistics
41% of Executive Chefs stay at the same job between one and two years.
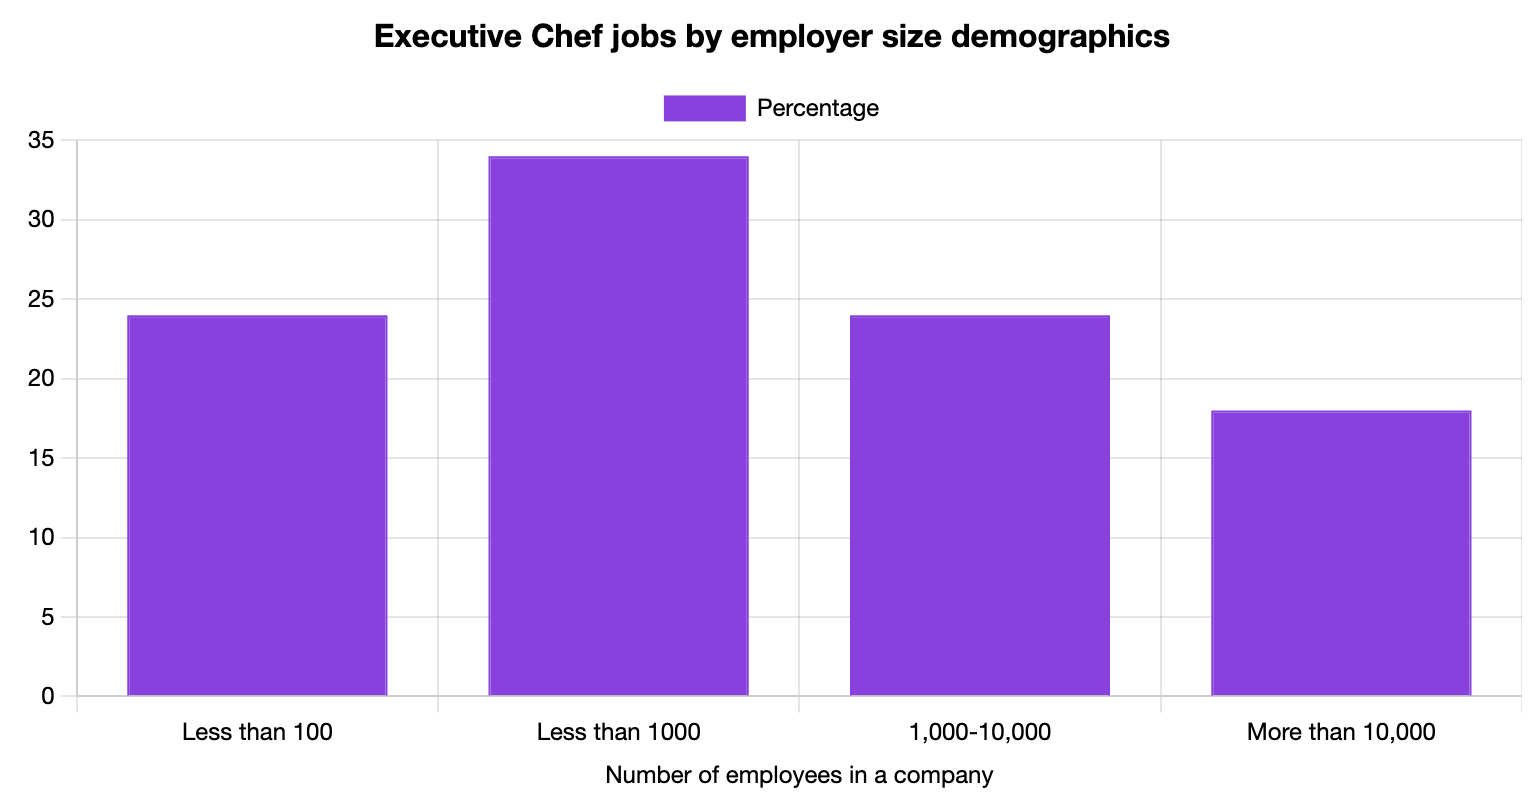
Executive Chef Company Size Statistics
34% of Executive Chefs work in companies that employ between 100 and 1,000 individuals.
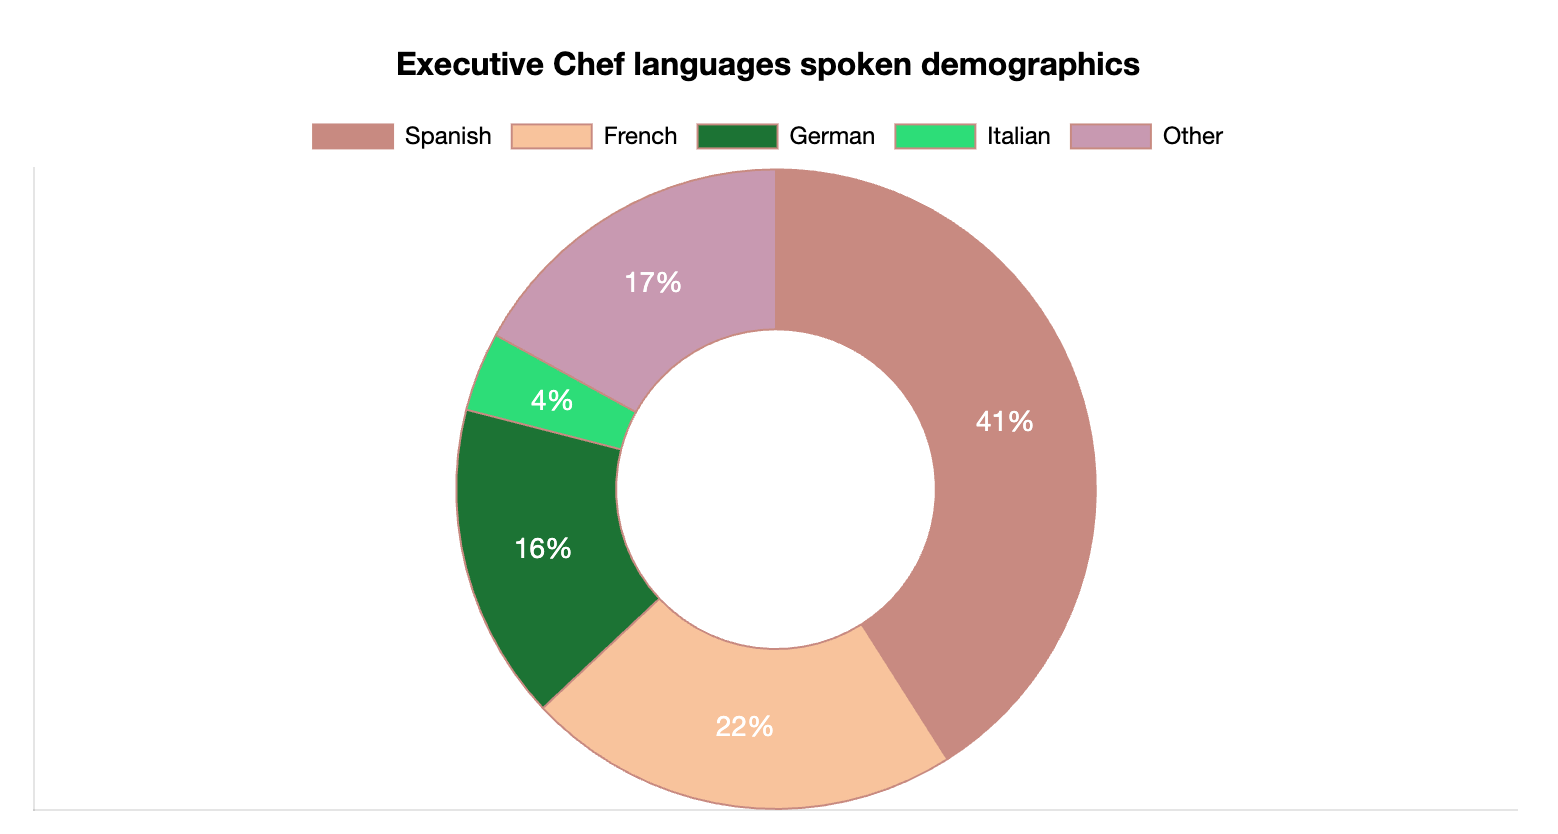
Executive Chef Languages Spoken
A lot of Executive Chefs typically speak English and another language. While Spanish is the most popular choice as a second language for Executive Chefs (41%), they also speak French, Italian and others.
See the breakdown of languages Executive Chefs speak below.
Additional Executive Chef Statistics
- Most Executive Chefs (56%) have an associate’s degree
- 15% of Executive Chefs stay at the same job for up to one year
- 24% of Executive Chefs work in companies that have less than 100 employees
- 3% of Executive Chefs speak Japanese
- Nevada is the highest-paid state for Executive Chefs ($97,600)
Executive Chefs Statistics and Demographics Data
We calculated our Executive Chef demographics using government and agency sources, combined with our own data.
Explore how we do it on our statistics and demographics methodology page.

Written by Vukasin Petrovic
Vukasin is an experienced content creator with more than five years of writing and editing experience. With a background in English and an MFA in Creative Writing, he excels in digital marketing and copywriting, crafting narratives that engage the audience.

Reviewed by Stefan Petrov
With over 10 years of experience as a writer and editor, Stefan has worked in the automotive, IT, health and hospitality industries. Familiar with Google Search Console and other SEO tools like Ahrefs and Semrush, Stefan uses his experience to create content that's visually appealing to the user but also ranks in the SERPs.