Director of Restaurant Operations Demographics and Statistics in the US – 2026
In this article, we take a look at some of the most important Director of Restaurant Operations demographics.
Below you’ll learn about Director of Restaurant Operations’ salaries, education degrees, where they work and more.
- The average Director of Restaurant Operations salary in the United States is $102,697 per year
- Directors of Restaurant Operations’ salaries in Miami are $102,694 per year
- Directors of Restaurant Operations’ salaries in NYC are $102,697
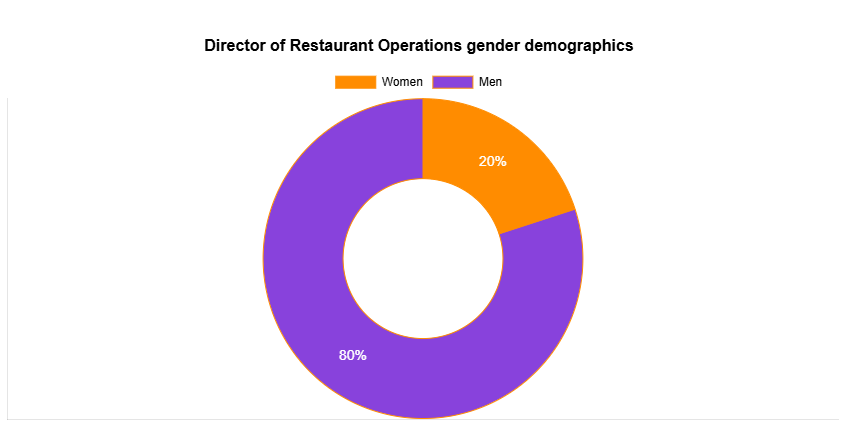
- 20% of all Directors of Restaurant Operations are women
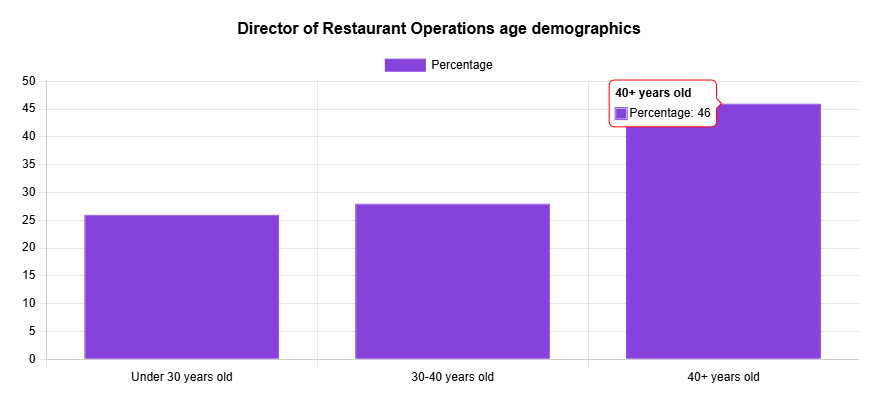
- 28% of Directors of Restaurant Operations are between 20 and 30 years old
Director of Restaurant Operations Employment Statistics
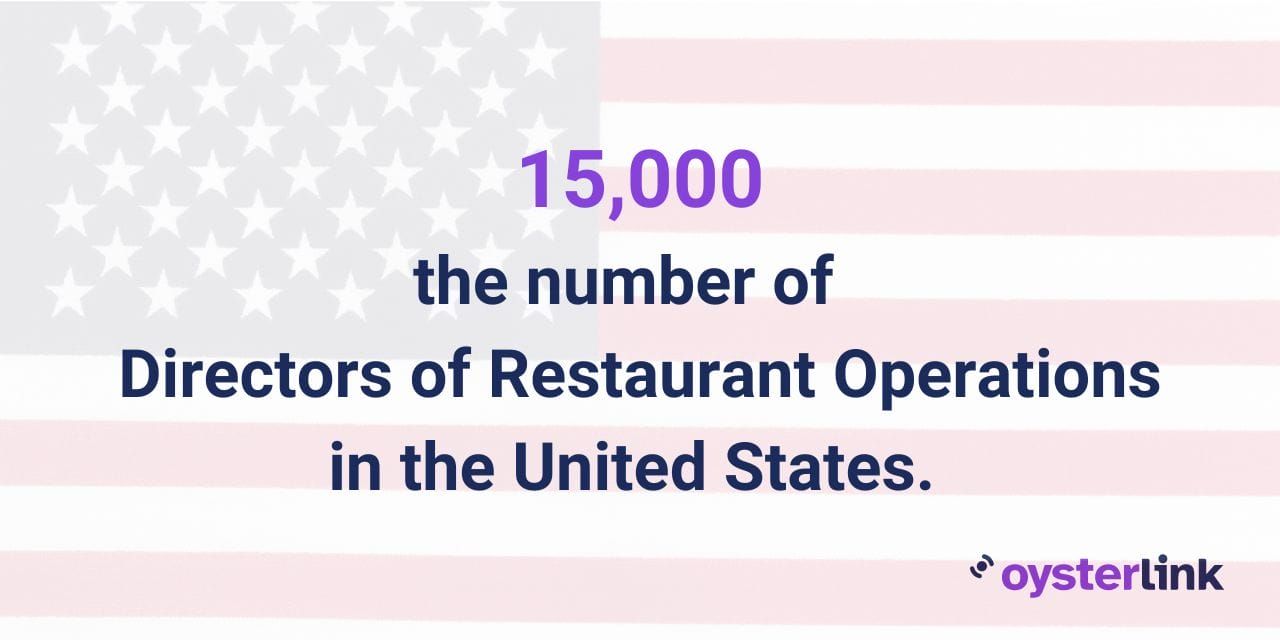
There are currently more than 15,000 Directors of Restaurant Operations in the United States.
Director of Restaurant Operations Gender Statistics
80% of individuals working as Directors of Restaurant Operations are men. This is similar to Kitchen Manager demographics where most individuals in the role are also men.
Director of Restaurant Operations Age
Most Directors of Restaurant Operations are older than 40 years.
Director of Restaurant Operations Ethnicity and Race Statistics
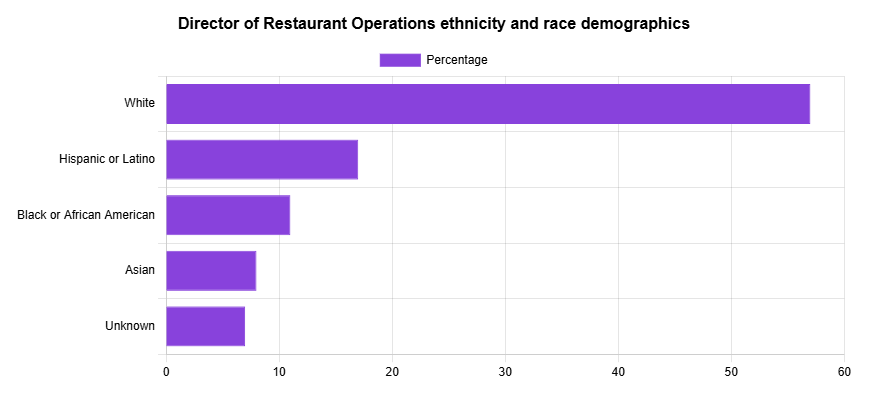
Most individuals working as Directors of Restaurant Operations in the United States are white. The Hispanic or Latino population comprises 17% of them, while Black or African American individuals are 11% of all Directors of Restaurant Operations.
This breakdown by race and ethnicity aligns with other roles, as you can see on our Restaurant Consultant demographics page.
Director of Restaurant Operations Education
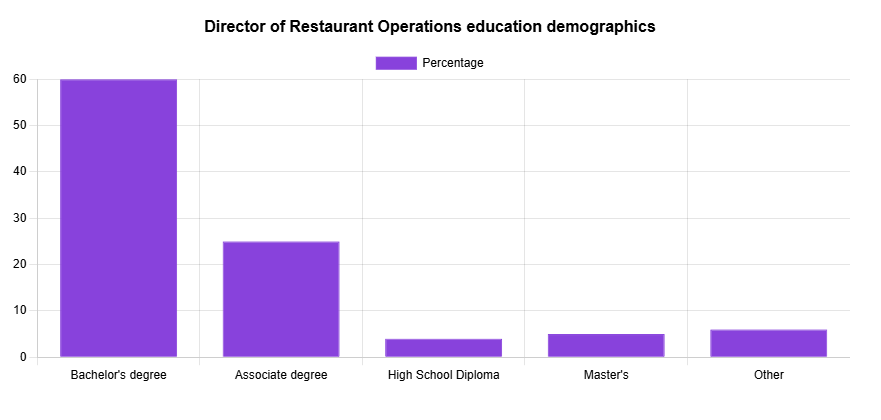
Most Directors of Restaurant Operations have a bachelor’s degree 60%. That said, it is possible to succeed in this role through experience in the hospitality industry and without extensive formal education.
You can explore our Head Chef demographics page to see what's the educational attainment of similar hospitality roles.
Director of Restaurant Operations Tenure Statistics
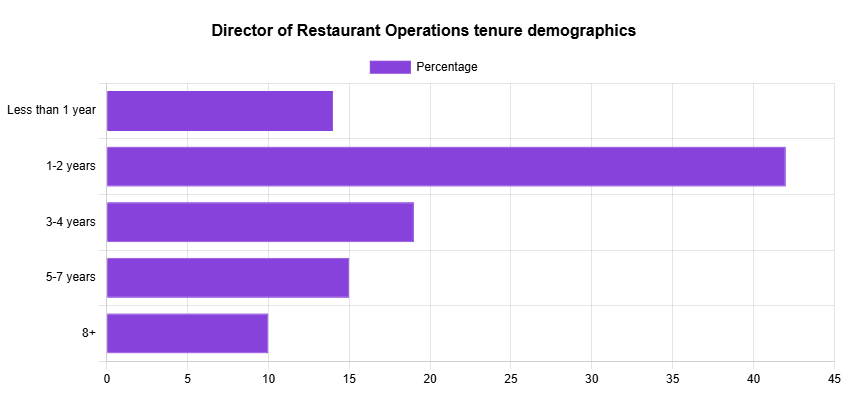
Most Directors of Restaurant Operations stay at the same job for between one and two years.
Director of Restaurant Operations Jobs by Company Size
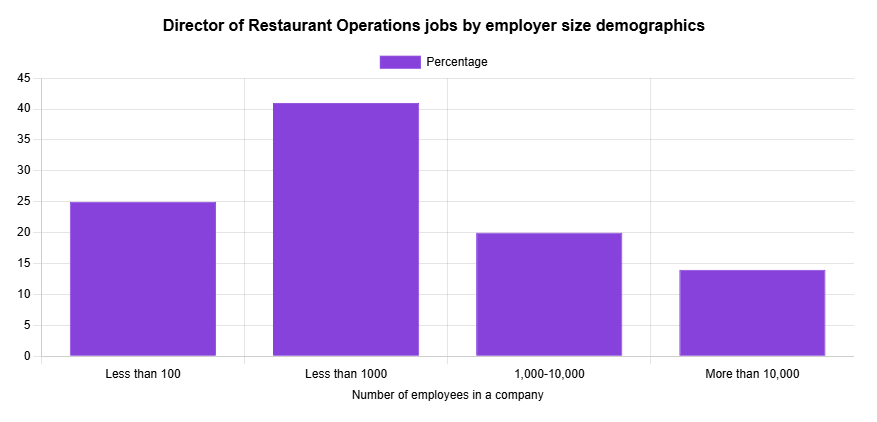
41% of all Directors of Restaurant operations work for companies that employ between 1,000 and 10,000 people.
Director of Restaurant Operations Languages Spoken
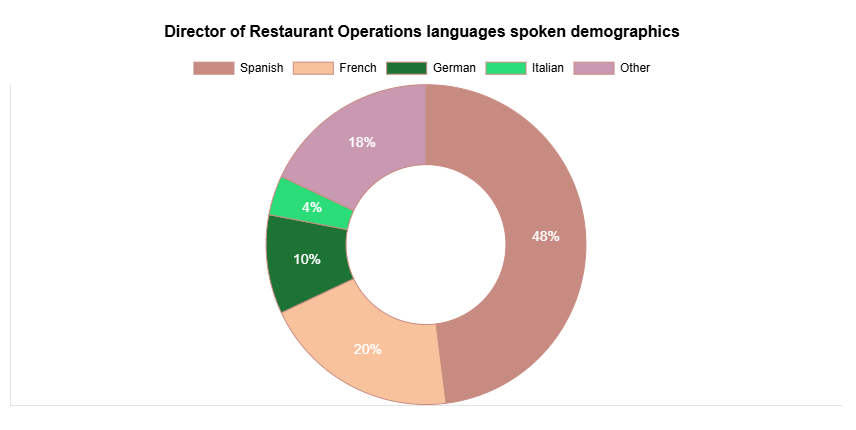
While all Directors of Restaurant Operations in the United States speak English, a big portion of them speak an additional second language. Spanish is the most popular (48%), but they also speak Italian, German and more.
Additional Director of Restaurant Operations Statistics
- 57% of all Directors of Restaurant Operations are white
- 5% of Directors of Restaurant Operations have a master’s degree
- 20% of all Directors of Restaurant Operations who know a second language speak French
- Wyoming is the highest-paid state for this role ($105,224)
Director of Restaurant Operations Statistics and Demographics Data
To calculate our Director of Restaurant Operations demographics data, we rely on government and agency websites.
See what we do on our statistics and demographics methodology page.

