Cook Demographics and Statistics in the US – 2026
We’ve gathered Cook statistics and demographics to help you learn about their education, where they work, top industries and more.
- The average salary for a Cook in the U.S. is $36,060 per year
- Top earners in the Cook role can earn $46,420 per year
- Cooks on the low end of the scale can expect to make $26,980 annually
- Cooks working in NYC make $42,460 annually
- Miami Cooks can expect to earn $36,380 each year
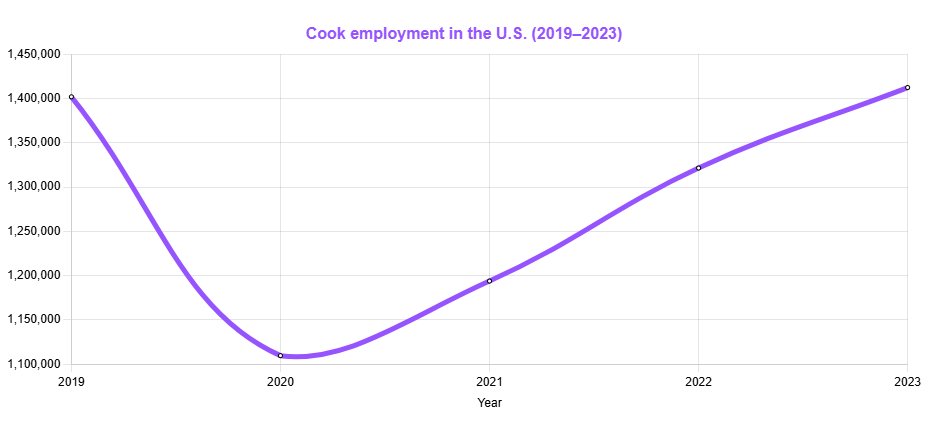
Cook Employment Statistics
There are 1,412,350 Cooks working in the United States.
Below you can see a graph showing how the number of Cooks in the U.S. changed during the last few years.
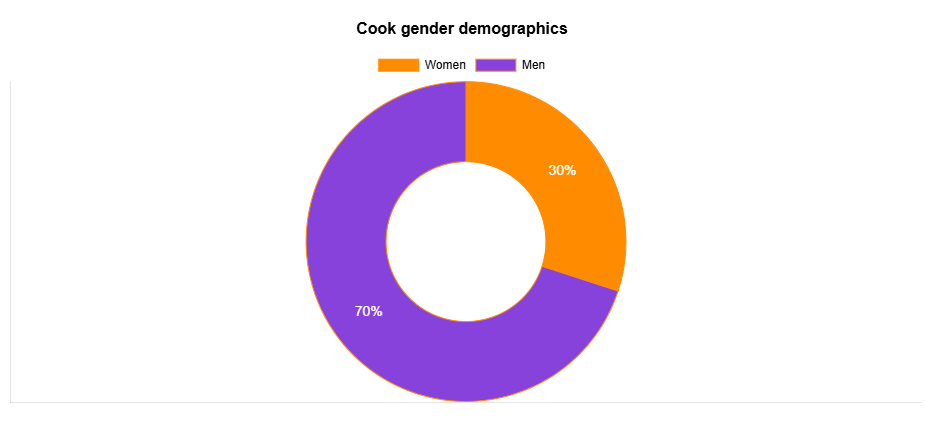
Cook Gender Statistics
70% of Cooks are men. This is similar to other kitchen roles, such as the demographics of Line Cooks.
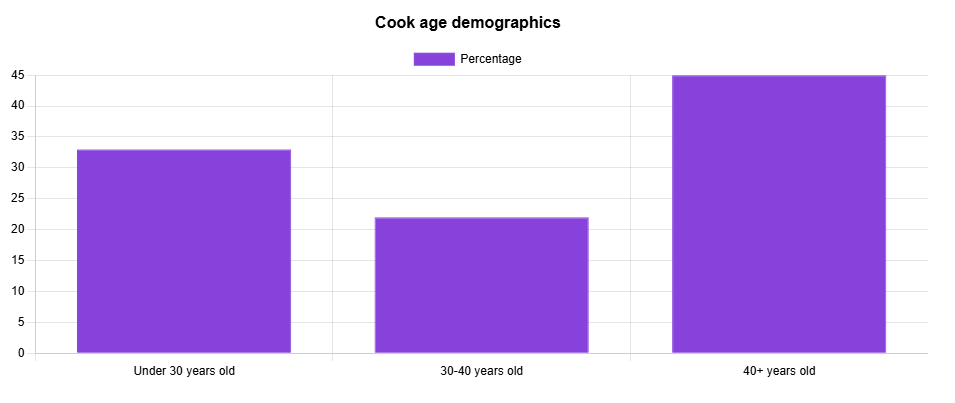
Cook Age Statistics
Just like with Pastry Chef demographics, most Cooks working in the United States are 40 years or older, 22% of them are between 30 and 40 years old while 33% of them are younger than 30.
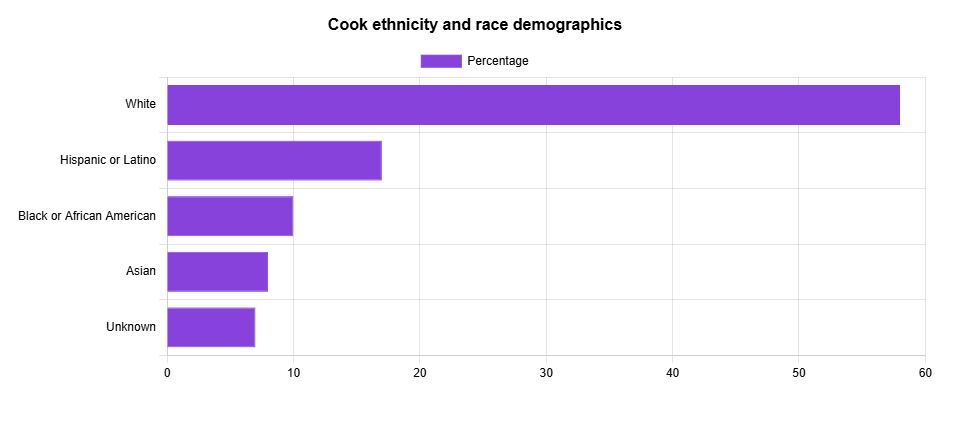
Cook Ethnicity and Race Statistics
While the majority of Cooks are white, 17% are Hispanic or Latino with 10% of them being Black (African American).
You can see Cook demographics and statistics by race and ethnicity below.
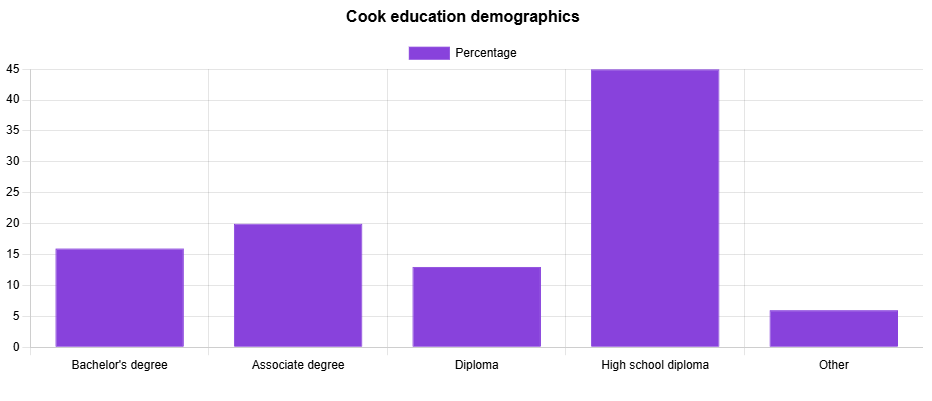
Cook Education Statistics
Cook roles in the U.S. typically don’t require extensive education. In fact, most Cooks (45%) were able to find a job with just a high school diploma. That being said, a good number of Cooks also have higher education levels, as you can see in the below graph.
Explore more roles that don't require extensive culinary education, such as our Prep Cook demographics page.
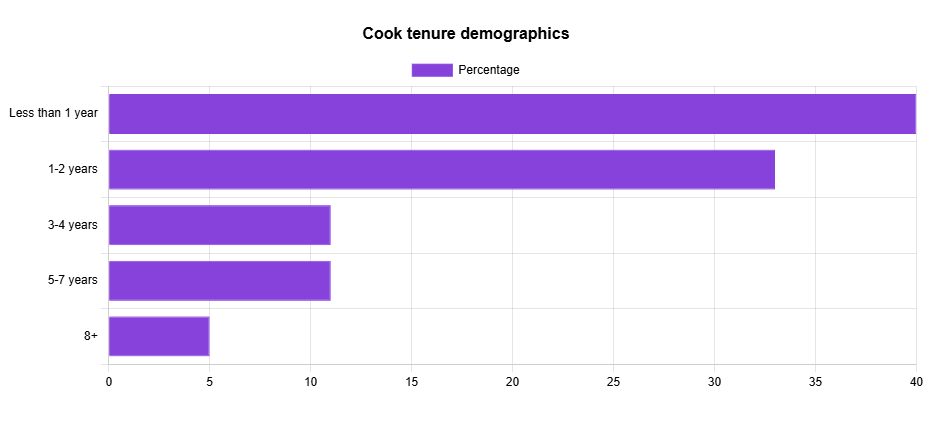
Cook Tenure Statistics
Given the high rates of turnover in hospitality, it is no surprise that most Cooks stay in the same position for less than a year (40%). Still, there are individuals in this role who stay at the same employer for over eight years (6%).
See how long Cooks stay with the same employer below.
Cook Industry Statistics
Cooks work in many settings across industries.
Below is a table showing where most Cooks work, according to data from the Bureau of Labor Statistics.
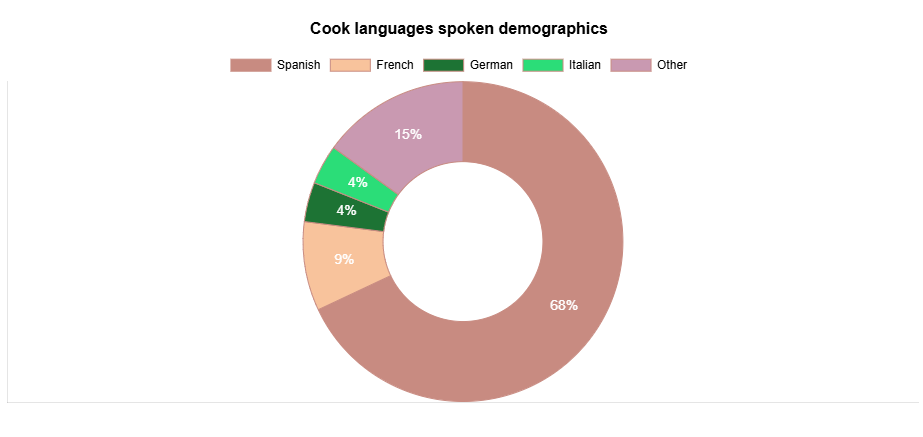
Cook Languages Spoken
Putting English aside, Cooks in the U.S. speak dozens of other languages.
While Spanish is the most popular second language, they also speak German, Italian and French.
See what languages Cooks in the United States speak below.
Additional Cook Statistics
- 30% of Cooks are women
- 45% of all Cooks are older than 40 years
- Most Cooks (58%) are white
- There will be a 6% increase in the number of Cook jobs for the period 2023-2033
- The top paying metropolitan area for this role is Kahului-Wailuku-Lahaina, HI ($ 51,130)
Cook Statistics and Demographics Data
We collect our Cook statistics and demographics from multiple government and agency websites.
You can see where and how we collect all of our data on the demographics methodology page.

Written by Vukasin Petrovic
Vukasin is an experienced content creator with more than five years of writing and editing experience. With a background in English and an MFA in Creative Writing, he excels in digital marketing and copywriting, crafting narratives that engage the audience.

Reviewed by Stefan Petrov
With over 10 years of experience as a writer and editor, Stefan has worked in the automotive, IT, health and hospitality industries. Familiar with Google Search Console and other SEO tools like Ahrefs and Semrush, Stefan uses his experience to create content that's visually appealing to the user but also ranks in the SERPs.