Baker Demographics and Statistics in the US – 2026
We collected the top Baker statistics and demographics in the United States.
Keep reading to learn about their salaries, education, where they work and more.
- The average Baker salary in the United States is $2,963 per month
- The top-earning individuals in the Baker role (90th percentile) can earn as much as $46,980 per year
- The lowest-earning individuals (10th percentile) make $24,960 per year
- Bakers working in Miami can expect to earn $34,100 per year on average
- Bakers working in NYC can expect to make $40,350 each year on average
Baker Employment Statistics
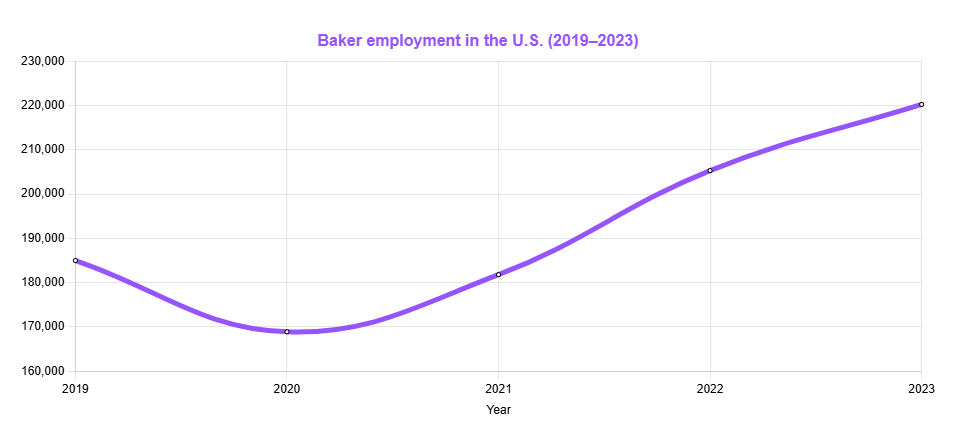
There are currently 220,230 Bakers in the United States.
Explore how the number of Bakers working in the U.S. changed over the past couple of years.
Baker Gender Statistics
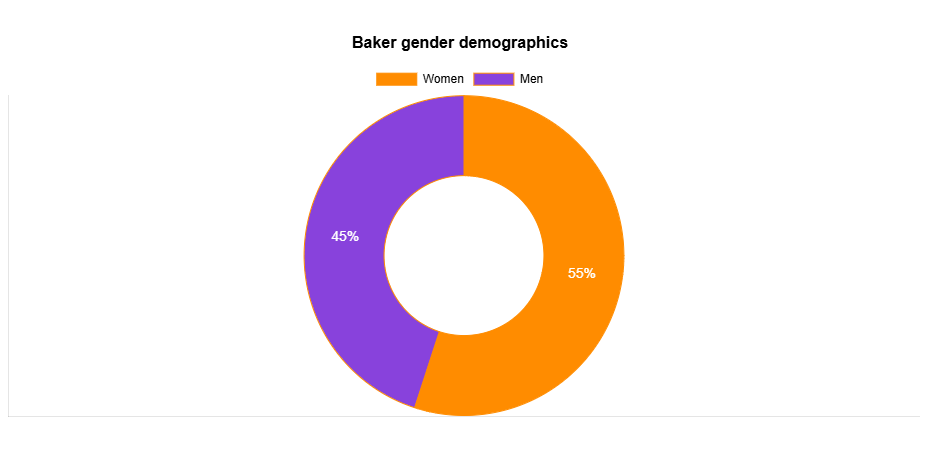
Just over half (55%) of all Bakers in the United States are women.
Baker Statistics by Age
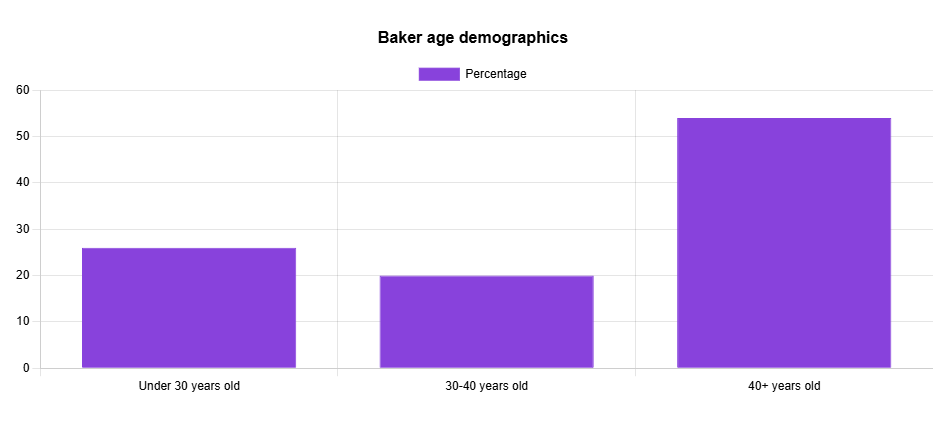
Most Bakers in the U.S. (54%) are older than 40 years. This is similar to Pastry Chef Demographics.
See the breakdowns of Bakers by age in the graph below.
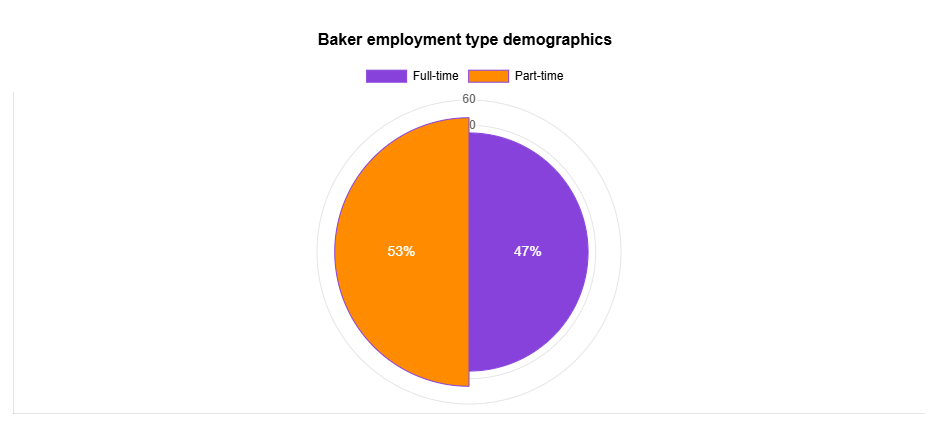
Bakers Employment Type Statistics
More Bakers (53%) work part-time than they do full-time, but only by a small margin.
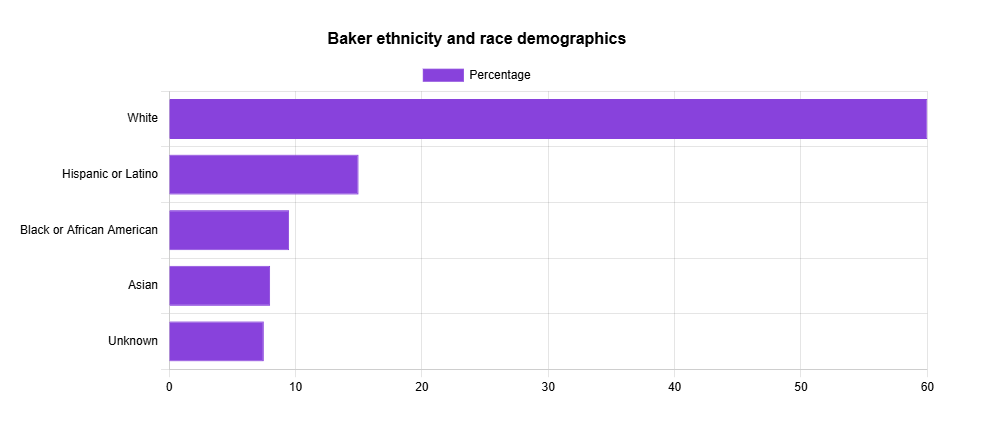
Baker Ethnicity and Race Statistics
While most Bakers are white, 15% of them are Hispanic or Latino and 9.5% of them are Black or African American.
This breakdown of Bakers by race and ethnicity aligns with other hospitality roles, such is the case with the Sous Chef demographics.
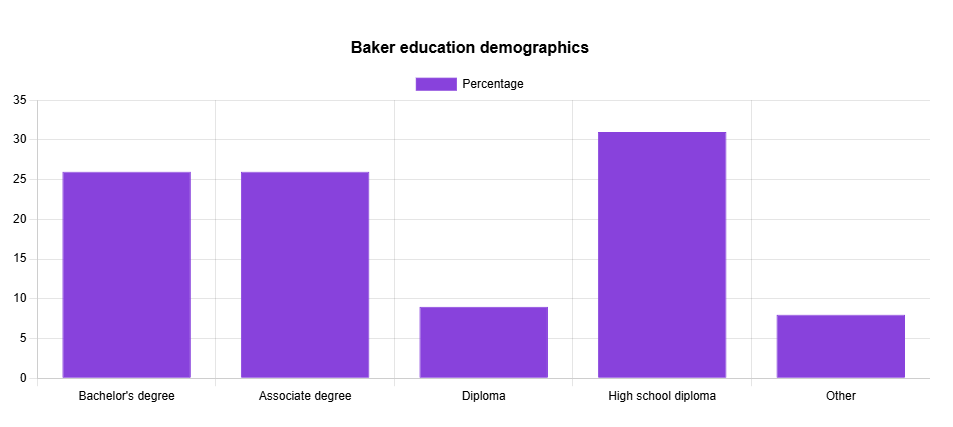
Baker Education Statistics
The Baker role typically doesn’t require extensive education. Most Bakers (31%) have a high school diploma, but there are those with associate and bachelor's degrees.
See the breakdown of Bakers by their education level below.
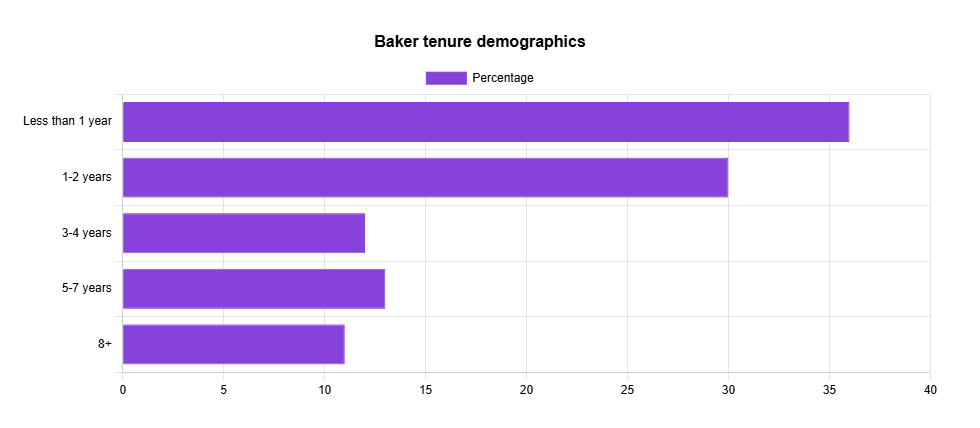
Baker Tenure Statistics
Bakers frequently change their place of employment. While most Bakers (36%) stay at the same company for up to a single year, there are also those (10%) who stay with the same employer for more than 10 years.
Baker Industry Statistics
Bakers can work in several industries for various types of employers, according to the Bureau of Labor Statistics.
See the breakdown of where Bakers work below.
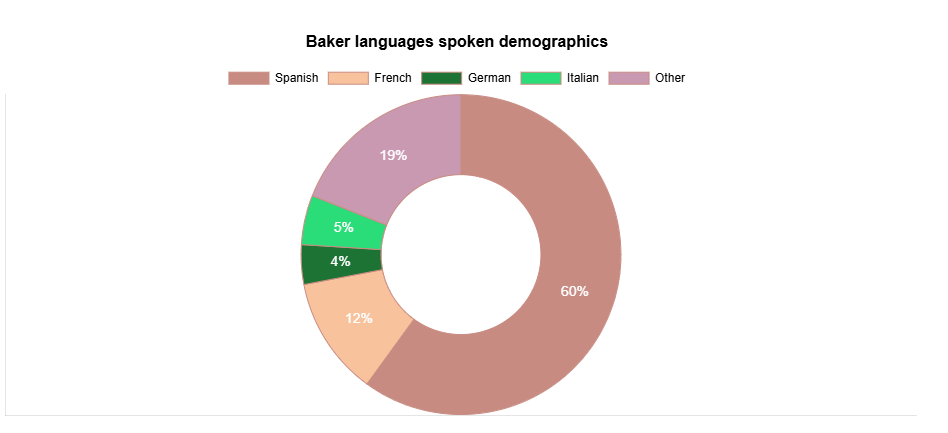
Baker Languages Spoken
Aside from English, Bakers also speak a number of other languages. The most common second language for Bakers is Spanish, with 60% of all Bakers who know an extra language speaking it.
Other roles also typically have a high number of individuals who speak Spanish as the second language, as you can see on our Sushi Chef demographics page.
See what other languages Bakers speak below.
Additional Baker Statistics
- 45% of all Bakers are men
- 26% of all Bakers are younger than 30
- Most Bakers (60%) are white
- 26% of all Bakers have a bachelor’s degree
Baker Statistics and Demographics Data
We used government and agency websites to collect our Baker statistics and demographics.
Explore how we do it on our statistics and demographics methodology page.

Written by Vukasin Petrovic
Vukasin is an experienced content creator with more than five years of writing and editing experience. With a background in English and an MFA in Creative Writing, he excels in digital marketing and copywriting, crafting narratives that engage the audience.

Reviewed by Stefan Petrov
With over 10 years of experience as a writer and editor, Stefan has worked in the automotive, IT, health and hospitality industries. Familiar with Google Search Console and other SEO tools like Ahrefs and Semrush, Stefan uses his experience to create content that's visually appealing to the user but also ranks in the SERPs.