This report breaks down the Bartender statistics in 2026, providing valuable insights into the current state of the U.S. bartending scene.
By the end of this article, you will better understand the factors driving growth, challenges and opportunities within the larger bartending industry.
Nationwide Bartender Employment and Job Outlook
Understanding the scale of the bartending profession begins with quantifying its workforce.
- There are about 745,610 Bartenders working in the U.S. That’s the highest number ever recorded for the profession in recent years.
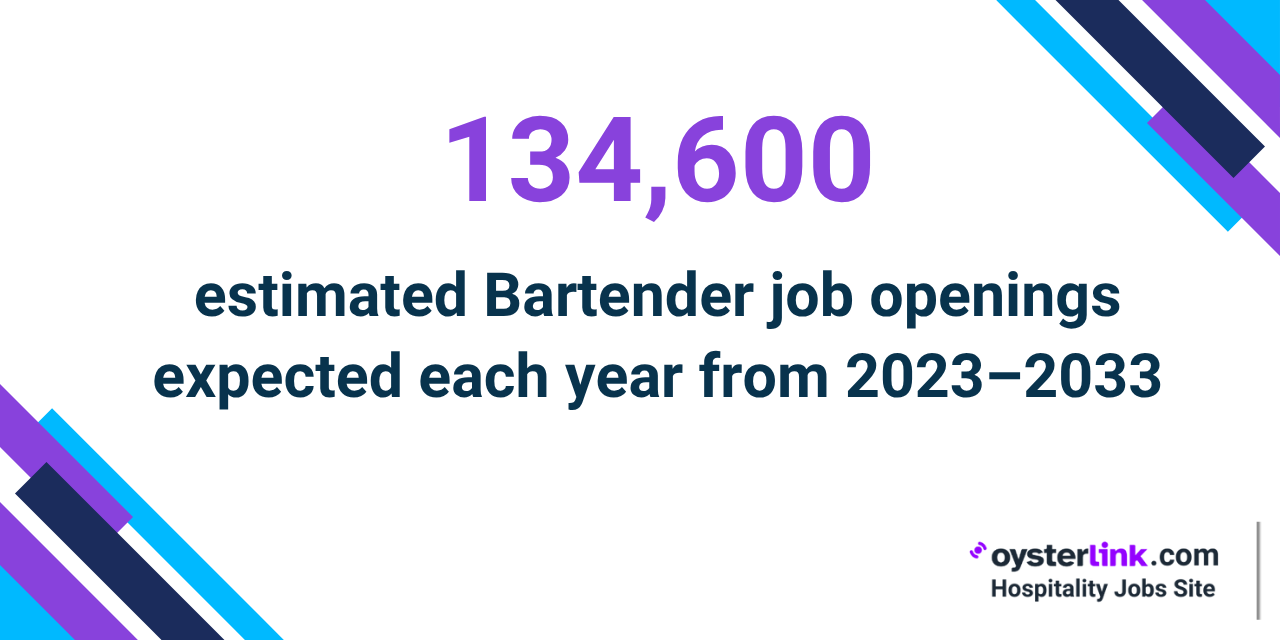
- An average of 134,600 openings each year over the decade from 2023 to 2033 indicates consistent opportunities for those in this profession.
- There is a 9% projected increase in the demand for Bartenders, which is notably faster than the average 4% for all occupations in the U.S.

The Fastest Growing
Restaurant & Hospitality Job Platform
Looking for top paid jobs? Or Hiring for your business?
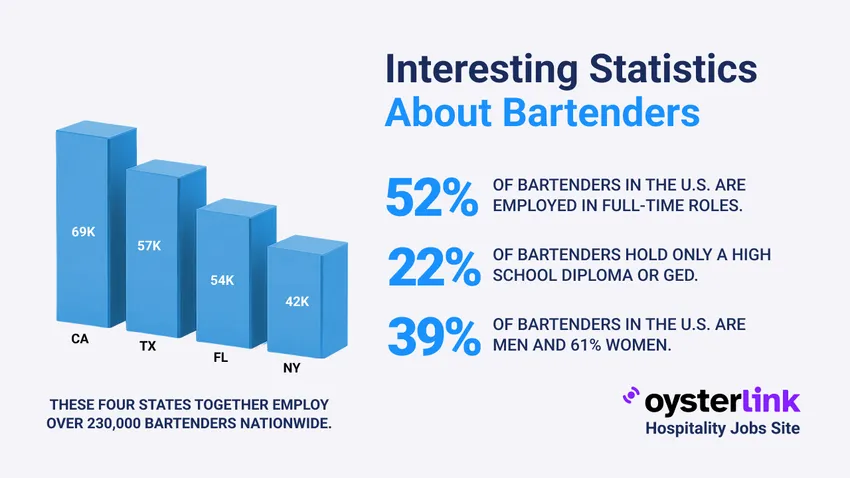
Bartender Employment by Location
Bartending opportunities vary widely across the U.S., with certain states and metropolitan areas offering significantly higher employment levels.
See also: How To Hire a Bartender: The Ultimate Guide for Employers
Demographics of US-Based Bartenders
The demographic makeup of the bartending profession offers valuable insights into the individuals who shape this industry.
- Women make up 61% of all employed Bartenders, while men account for 39%.
- Bartenders often work evenings, weekends and holidays, with 52% in full-time roles and 48% part-time.
- Although more women are currently Bartenders, new data suggests rising interest among men (60%) entering the profession.
- Currently, the average age for male Bartenders is 34, while for female Bartenders it is 30.
- Recent data shows that 39% of Bartenders are under 30 years old, 35% are between 30 and 39 and 26% are aged 40 or older.
- A significant 45% of Bartenders hold a bachelor’s degree.
- 22% hold a high school diploma or GED and another 22% possess an associate’s degree.
- The three most common degree programs among Bartenders who have finished college are Business (17,857 graduates), Visual & Performing Arts (10,399) and Social Sciences (7,686).
The Fastest Growing
Restaurant & Hospitality Job Platform
Looking for top paid jobs? Or Hiring for your business?
Bartender Statistics on Salary and Overall Income
Compensation for Bartenders in the U.S. is heavily influenced by various factors such as location, season and tips.
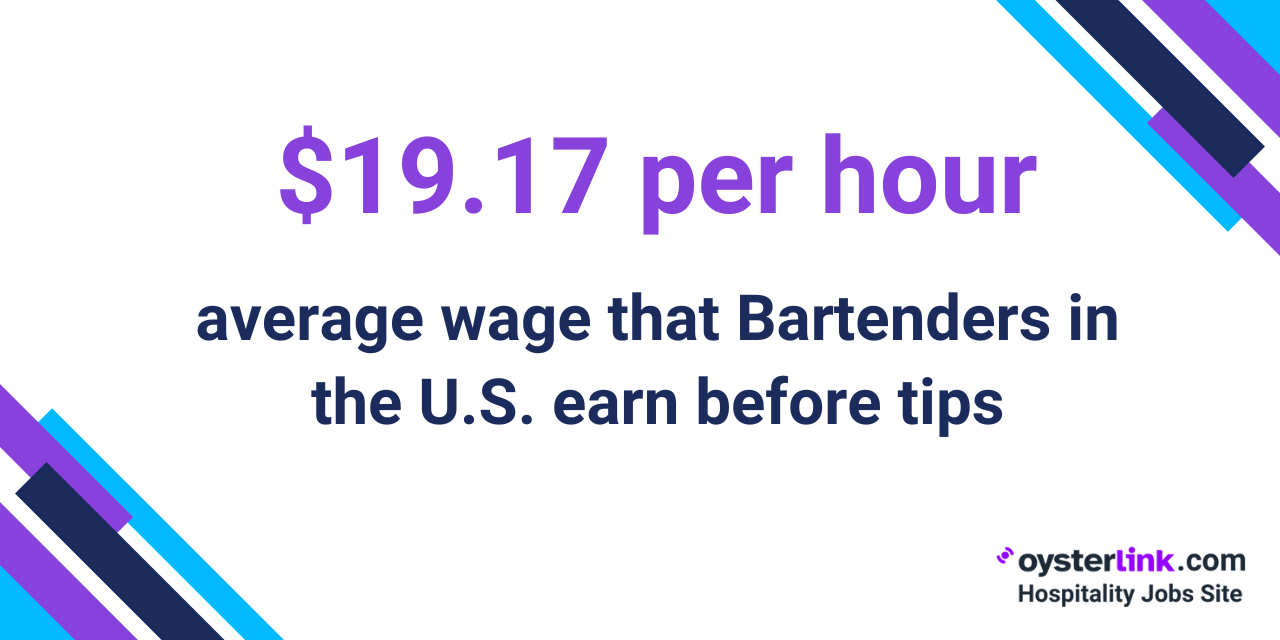
- Bartenders earn $39,880 per year (before tips), on average.
- This translates to an average base wage of $19.17 per hour (before tips).
- The top 10% (or 90th percentile) of Bartenders earn around $71,920 yearly or $34.58 hourly.
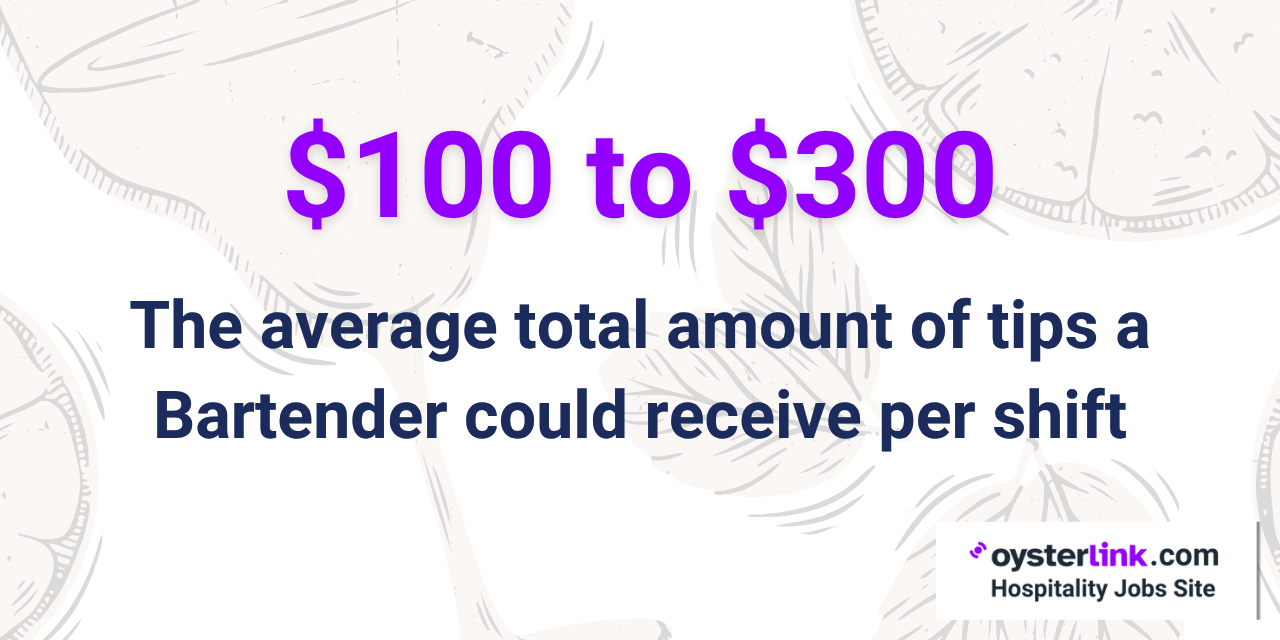
- On average, tips that Bartenders receive can range from $100 to $300, representing a substantial potential for higher earnings.
- The highest-paying state for Bartenders is Hawaii, where the average base salary is $71,570 a year.
- Coming in second and third are New York ($62,080 a year) and the District of Columbia ($60,420 a year).
- On a metro area basis, Bartenders are likely to earn the highest salaries in Kahului-Wailuku ($87,800 a year).
- Major events and local festivals often provide a significant increase in sales for bars and restaurants.
- For Bartenders, this means higher chances of getting tips due to the influx of patrons.
Use our Paycheck Calculator to figure out exactly how much your take-home pay is.

Data on Bartender Job Satisfaction
While compensation is a significant factor, job satisfaction in the bartending profession is a more complex equation.
- Bartenders report an overall career happiness rating of 3/5.
- On average, Bartenders rate their satisfaction with their salaries 3.1/5.
- Bartenders rated how well their personality matches their job at an average of 4.1/5.
- Bartenders rated their work environment an average of 3.5/5.
- With an average rating of just 2.4/5, many Bartenders feel their skills aren’t being fully used on the job.
Understanding these figures can help identify key factors contributing to turnover rates within the broader hospitality industry.
See also: High Turnover in Hospitality
Demographics and Income by Establishment Type or Sector
The characteristics of the bartending workforce and their income can also vary depending on the specific type of place where they work.
- Restaurants and eating places are the largest employers, accounting for 334,410 Bartenders.
- Following closely are drinking places (e.g., bars and pubs) which employ around 182,290 Bartenders.
- Dive bars and neighborhood pubs have a higher proportion of female Bartenders compared to craft cocktail bars.
See also: What Restaurants and Bars Do Bartenders Make the Most Money At?
The Fastest Growing
Restaurant & Hospitality Job Platform
Looking for top paid jobs? Or Hiring for your business?
Bartending Industry Key Trends and Statistics
As a Bartender or business owner, here are further data and figures you should know.
- The revenue for bars and nightclubs in the U.S. is projected to reach $38 billion.
- The alcoholic beverage market is currently valued at $415 billion. It’s expected to reach $702.96 billion by 2032.
- Alcohol prices have risen 1.4% over the past year, with bars seeing a 4% increase for beer and 2.7% for hard liquor.
- Wine is widely seen as “timeless” and ideal for food pairings, with both wine and spirits viewed as suited for formal occasions.
- In contrast, beer is associated with being “affordable,” “casual” and “convenient”, often favored for daytime drinking.
- The average U.S. household spends around $350 per year on alcoholic drinks consumed at bars, restaurants and other venues.
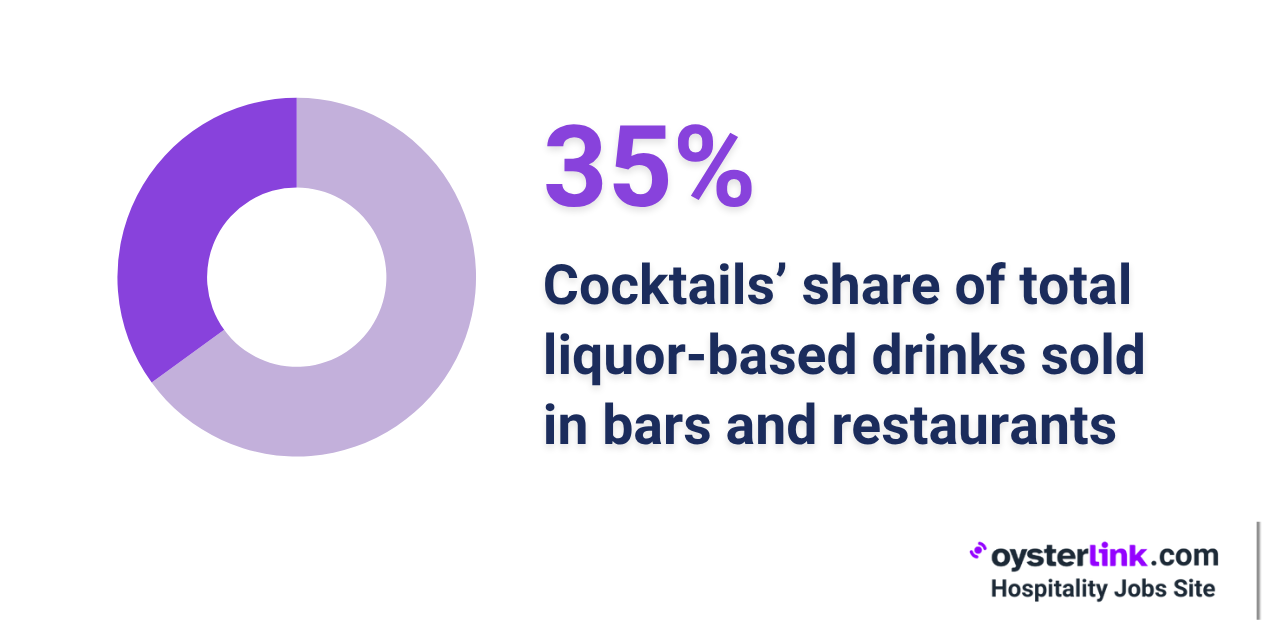
- Cocktails currently make up 35% of all spirits sales in U.S. bars and restaurants.
- With the average cocktail price being $13.50, these help push the typical guest check to $86.35.
- Margarita is the most popular cocktail in U.S. bars.
- Negroni is one of the most profitable drinks. A single serving currently sells for $16.
- Tequila accounts for more than a third (34.1%) of all cocktail base sales by value in the U.S.
- The espresso martini also saw significant growth, experiencing a 116% increase in the third quarter year-over-year.
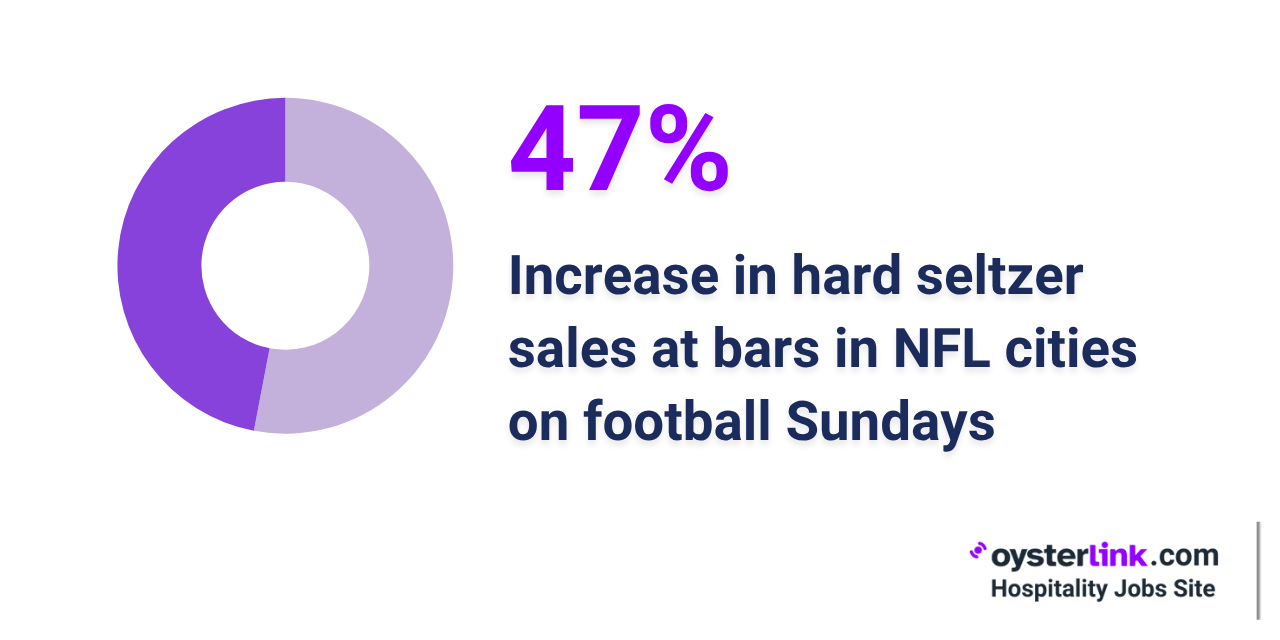
- On Sundays during football season, bars in NFL-market cities report a 47% increase in hard seltzer sales.
- Lagers, red wine, whiskey and liqueurs also rank among the top five categories with the biggest NFL Sunday boosts.
- On February 14, wine orders increase by around 240% compared to the average day.
- 31% of U.S. consumers have already used AI to discover or help them choose drinks, while 71% are interested in doing so.
- More than 40% of consumers say they’d trust AI to suggest drink pairings at a restaurant.
- 26% would let AI choose their cocktail at a bar, and 39% would use it to select beverages for a party or gathering.
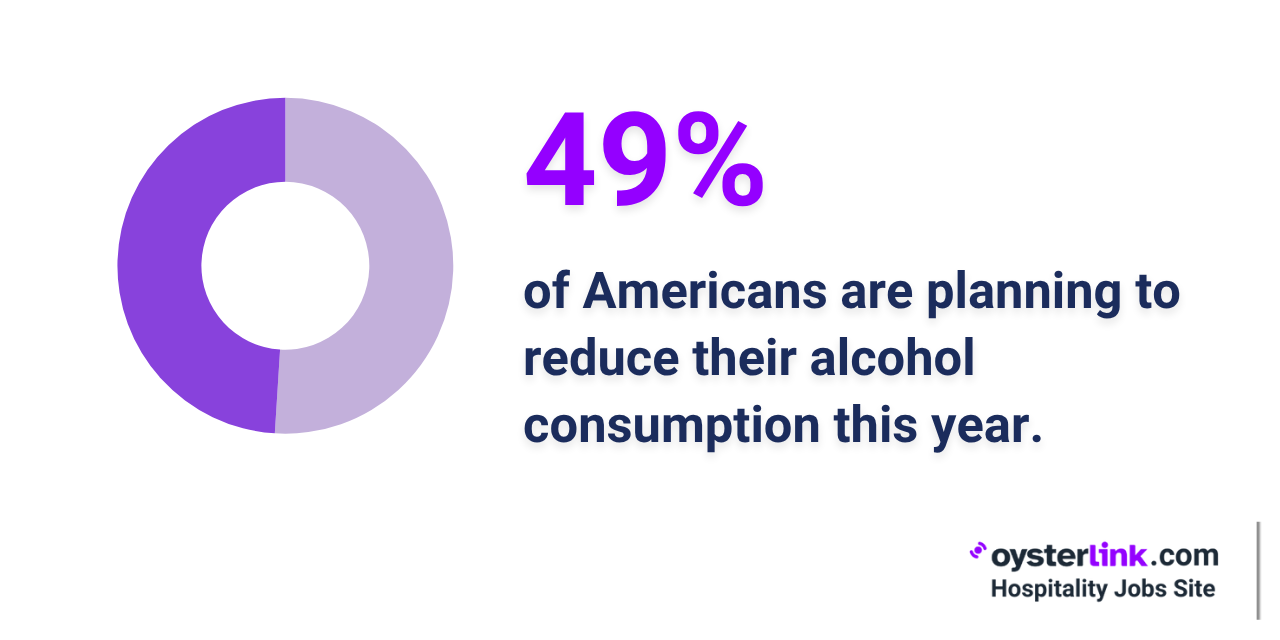
- About 49% of U.S. consumers said they plan to cut back on alcohol in 2026.
- The non-alcoholic beverage market is currently valued at $597 billion and is projected to surpass $700 billion by 2028.
- Approximately 38% of Gen Z drinkers reported purchasing more non-alcoholic beverages compared to the previous year.
- In contrast only 8% of Boomers, 15% of Gen X and 25% of millennials did the same.
- Bartenders are increasingly adopting techniques like fat-washing and flavor infusions to diversify cocktail offerings.
- To enhance efficiency and consistency, more and more bars are embracing pre-batched cocktails.
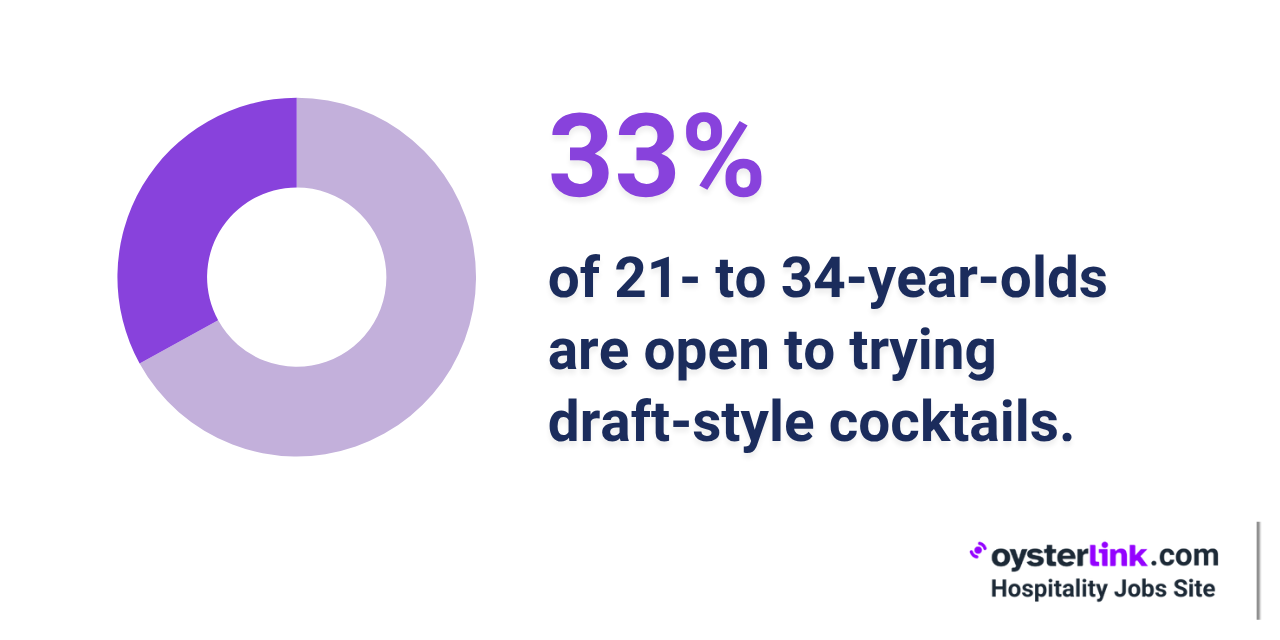
- About 33 % of consumers aged 21 to 34 say they’ve tried (or want to try) draft or pre-batched cocktails.
- Robot Bartenders are gaining traction, with the market growing 17–30% annually.
- Cruise ships, casinos and airports are embracing robot Bartenders for their ability to serve 800–1,500 drinks daily without breaks.
Check Our Career Growth Tools
Bartender Statistics: Conclusion
Bartending in 2026 is a dynamic career shaped by innovation, shifting demographics, and evolving customer trends.
With over 740,000 Bartenders nationwide, the industry is growing fast, but so are the challenges of pay, satisfaction, and retention.
Whether you’re looking to land your first bartending role, take the next step in your hospitality career, or hire top talent, OysterLink is the platform built to connect you with success.


Loading comments...