This report explores Barista statistics in 2025, offering a detailed look at the current landscape of the U.S. coffee and cafe industry.
Whether you're a current Barista, an employer or someone considering a career in beverage service, these insights shed light on how the industry is evolving and what opportunities lie ahead.
Nationwide Barista Employment and Job Outlook
Understanding the size of the Barista workforce is key to grasping its impact on the coffee and beverage industry.
- There are currently over 474,000 individuals employed as Baristas across the country.
- There are about 93,300 active Barista job openings.
- The Barista job market is anticipated to grow by 4.6%, which is slightly faster than the general average for all occupations.
- Job opportunities vary widely across the country, with certain states like California and Texas employing significantly more Baristas than others.
- Forecasts show a need for 23,100 new Baristas to meet rising demand and 9,400 more to replace retirees over the next decade.
- Estimates suggest that the number of Baristas will rise to 1,058,480 job openings by 2029.

The Fastest Growing
Restaurant & Hospitality Job Platform
Looking for top paid jobs? Or Hiring for your business?
Demographic Profile of Baristas in the US
The demographic composition of Baristas in the United States reveals several key characteristics.
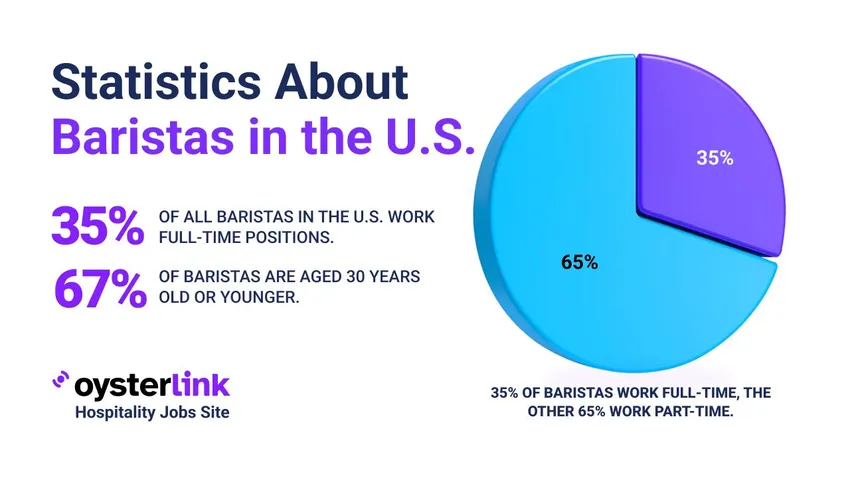
- Recent data shows that only 35% of Baristas hold full-time positions, while the remaining 65% work part-time.
- The profession is predominantly female, with women comprising 74% of the Barista population, compared to 26% for men.
- There is also a slightly higher interest in becoming a Barista among women (52%) compared to men (48%), with a ratio of 1.10 to 1.
- The average age for both male and female Baristas is 21.
- A significant majority, around 67%, are under the age of 30.
- Approximately 43% of Baristas in the U.S. hold bachelor's degrees.
- The majority of Baristas in the U.S. are White, accounting for 69% of the workforce. Latinos and Hispanics represent the second-largest group at 8%.
- Around 58% of Baristas in the U.S. who speak a second language are fluent in Spanish.
Barista Statistics on Salary and Overall Income
The earnings of U.S.-based Baristas depend on several factors.
- Baristas make $34,825 per year (before tips), on average.
- Most Baristas earn hourly wages, with the U.S. average being $16.74 per hour (before tips).
- Baristas typically earn an additional $2 to $5 per hour in tips, which can significantly supplement their base wage.
- The District of Columbia leads as the highest-paying location for Baristas, where the average annual salary is $39,521.
- Oregon follows at $37,984, with California close behind at $37,933.
Bookmark our Paycheck Calculator to easily figure out exactly how much your take-home pay is.
The Fastest Growing
Restaurant & Hospitality Job Platform
Looking for top paid jobs? Or Hiring for your business?
Job Satisfaction and Retention in the Barista Profession
Below, we’ll look at key points that provide insights into the overall health and sustainability of this workforce segment.
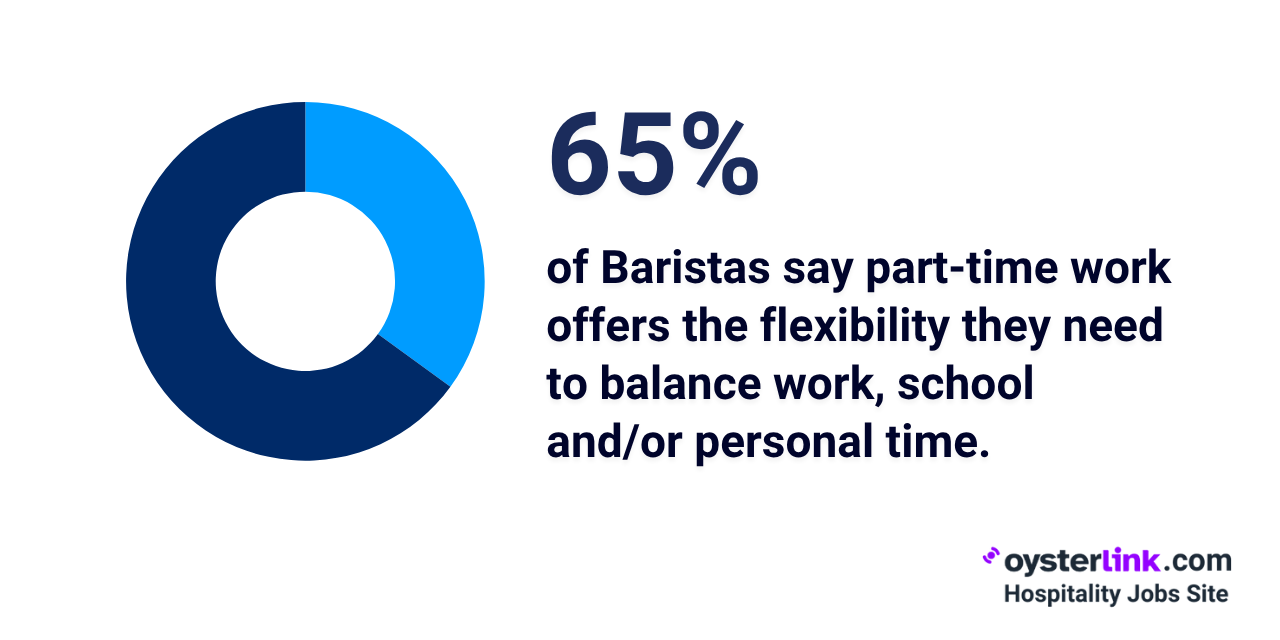
- Many Baristas appreciate the flexibility of part-time work, with 65% valuing it for better work-life balance.
- Most Baristas rate their overall job satisfaction as 2.9/5, which puts them in the bottom 25% of professions.
- Baristas rated their salary satisfaction at 2.6/5, with only a few reporting contentment with their pay.
- On average, Baristas rated their personality fit with their work at 3.8/5.
See also: Pros and Cons of Being a Barista
The US Coffee Shop Market: Size, Revenue and Key Players
Coffee shops play a crucial role in shaping the Barista profession, with major chains and independent cafes driving employment and industry trends.
- The U.S. coffee shop market is projected to reach $57 billion in 2025 and then $72 billion by 2028.
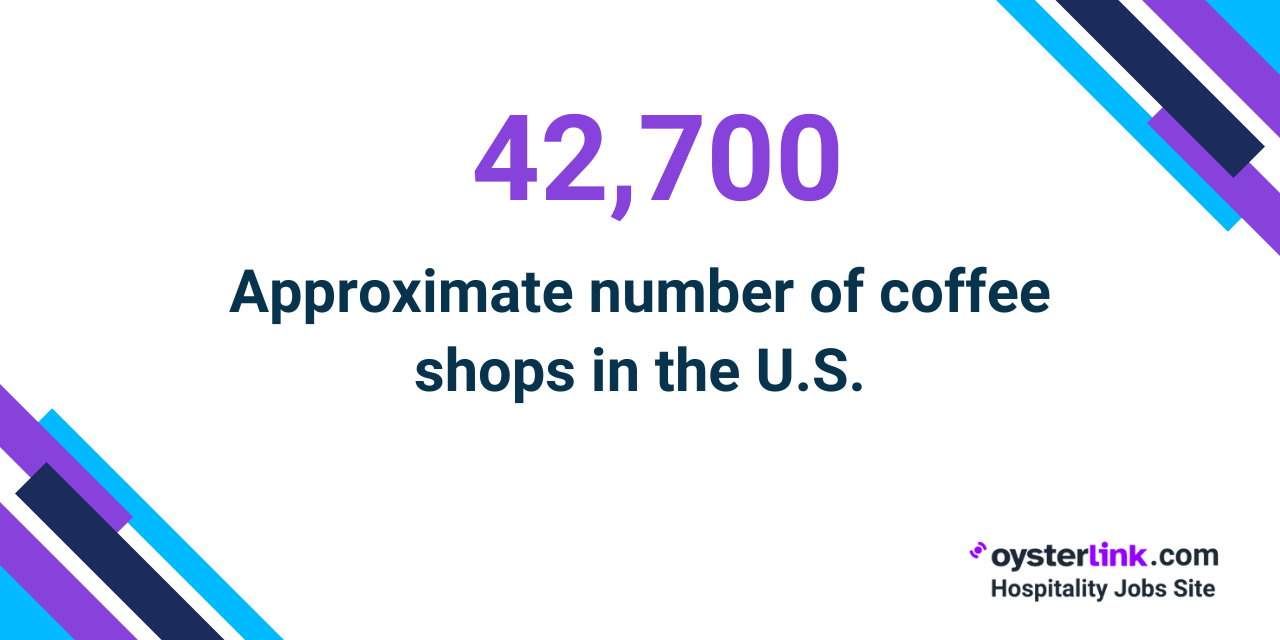
- The U.S. has over 42,700 coffee shops (including both independent and franchise brands), to date.
- Meanwhile, the branded coffee shop market is expected to exceed 51,100 outlets by September 2029.
- The broader U.S. coffee market generates approximately $80 billion in annual revenue.
- Starbucks leads the U.S. coffee shop market with a commanding 40% share, followed by Dunkin’ at 26% and Dutch Bros. at 3%, while all other chains combined make up the remaining 31%.
See also: Restaurant Consumer Trends [2025 Report]
The Rise of Specialty Coffee in the US Market
Specialty coffee has emerged as a significant and rapidly expanding segment within the broader U.S. coffee industry.
- The specialty coffee market in the U.S. is projected to grow to $52.1 billion in 2025, reaching $81.8 billion by 2030.
- Specialty coffee now makes up 59% of all coffee consumed in the U.S.
- Meanwhile, the global specialty coffee market is projected to reach $183.0 billion by 2030.
- A survey found that 70% of coffee drinkers are willing to pay more for higher-quality coffee.
- Consumers aged 18 to 24 account for the largest share of revenue in the U.S. specialty coffee market.
- Meanwhile, the 25 to 39 age group is expected to drive the fastest growth.
- In the same survey, 66% of these consumers aged 25 to 29 have drunk specialty coffee in the past seven days.
.png)
US Coffee Consumption Trends
Americans' coffee habits continue to evolve, driven by shifting preferences, lifestyle changes and new brewing innovations.
- About 51% the population buys coffee from a coffee shop at least once a week.
- Coffee remains a cornerstone of American daily routines, with over 73% of adults consuming it daily.
- Around 20% of Americans spend $20 or less per month on coffee from cafes.
- The average American coffee consumption rate is approximately 1.87 cups per day.
- Specialty coffee drinkers consume an average of 2.8 cups per day.
- 22% of Americans reported drinking an espresso-based beverage in the past day.
- Among coffee shop patrons, 38% say flavored lattes are their go-to, followed by flat whites (32%) and filter coffee (31%).
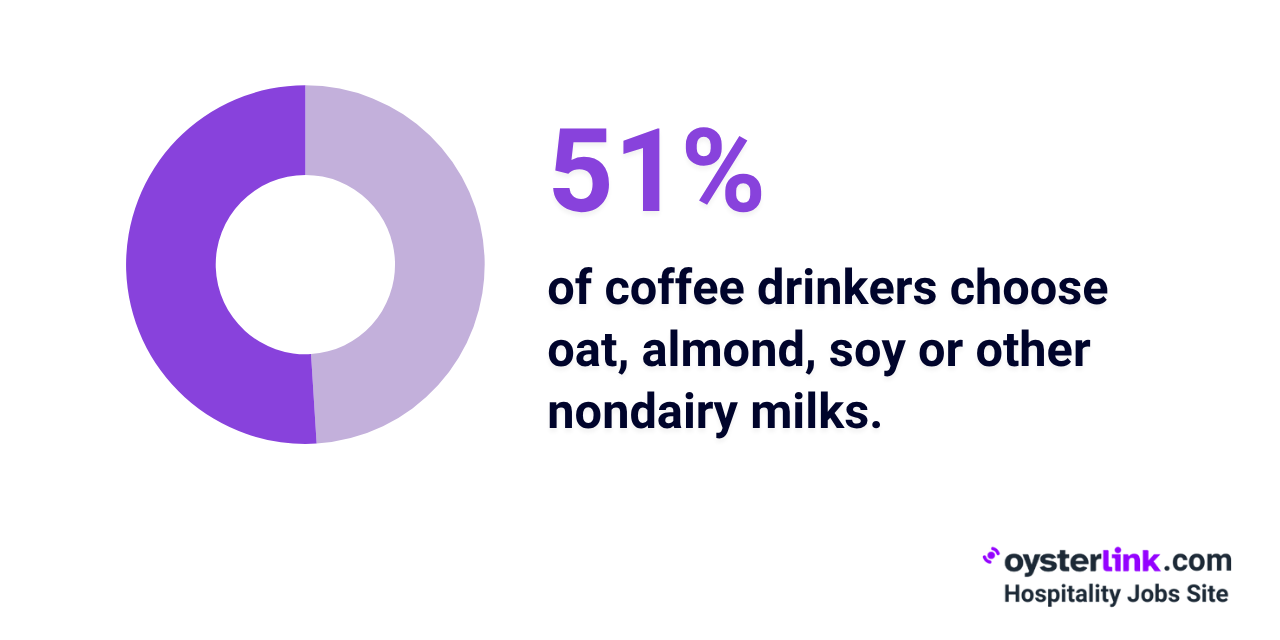
- Around 51% of U.S. coffee drinkers now opt for oat, almond, soy or other nondairy milk in their coffee.
- Within specialty coffee, both espresso and non-espresso drinks are growing, with ready-to-drink coffee now the third most popular preparation method.
The Fastest Growing
Restaurant & Hospitality Job Platform
Looking for top paid jobs? Or Hiring for your business?
Economic Impact of the Coffee Industry
The coffee industry in the U.S. exerts a substantial and multifaceted impact on the national economy
- The coffee industry is a major source of employment, responsible for over 2.2 million U.S. jobs and generating more than $100 billion in wages annually.
- Coffee businesses contribute significantly to government revenue, paying over $37 billion in federal, state and local taxes each year.
- For every $1 in coffee imported into the United States, an estimated $43 in value is created within the domestic economy.
.png)
- On average, Americans consume 4.7 kilograms (10.3 lbs) of coffee annually (roughly three cups a day).
- In the U.S. alone, Starbucks generated $36.5 billion in sales in 2024, securing a top ranking (#319) on the Forbes Global 2000 list.
- Starbucks in the U.S. stores are expected to sell about 5 million drinks per day.
See also: Economic Indicators for the Restaurant Industry in 2025
Barista Statistics in 2025: Conclusion
With over 474,000 Baristas, rising job demand and a strong shift toward specialty coffee, the role continues to evolve alongside changing consumer tastes.
While job satisfaction is moderate and part-time work remains common, the industry’s economic impact is undeniable — supporting millions of jobs and generating billions in revenue, wages and taxes.
The Fastest Growing
Restaurant & Hospitality Job Platform
Looking for top paid jobs? Or Hiring for your business?


Loading comments...