Restaurant Manager Demographics and Statistics in the US – 2026
In this article, we’ve outlined some of the most useful, interesting and surprising statistics that will help you better understand the profile of Restaurant Managers in the United States.
- The average monthly salary of a Restaurant Manager is $5,798
- The lowest-paid state for Restaurant Managers is West Virginia, at an average annual wage of just under $52,000
- The highest-paid state for Restaurant Managers is Washington, where they earn more than $87,000 per year
- Most employers look for 5 years of experience when hiring for this role
- The growth rate for this role is estimated at 0% for the next eight years
- It is estimated that there will be 39,600 new Restaurant Managers openings every year
- The U.S. is one of the largest hospitality hubs in the world, currently providing more than 15 million jobs in the food and beverage industry
- The cost to hire and train a new hospitality manager can be as high as $15,000
Restaurant Manager Employment Statistics: Workforce Overview
Over 246,000 professionals are currently employed as Restaurant Managers across the United States, highlighting the importance of the restaurant industry in the country’s workforce.
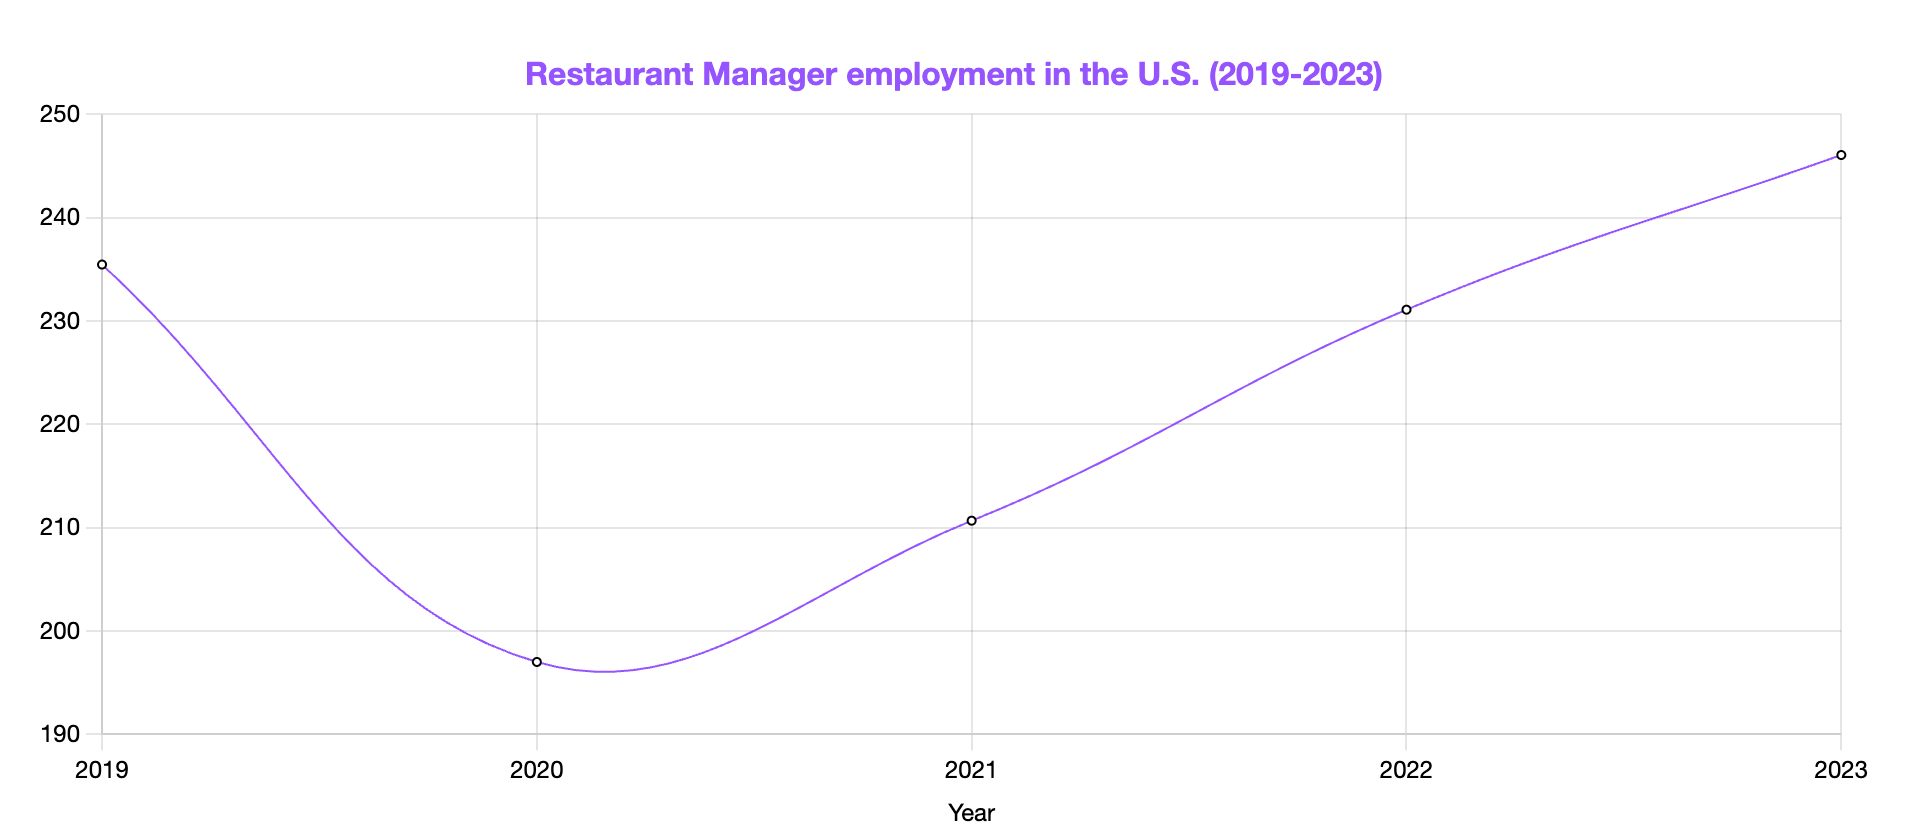
Even though it's projected there will be little to no change when it comes to Restaurant Manager growth in the next decade, the good news is that last year's increase in employment has surpassed the pre-pandemic numbers of employees.
Gender Ratio and Diversity Among Restaurant Managers
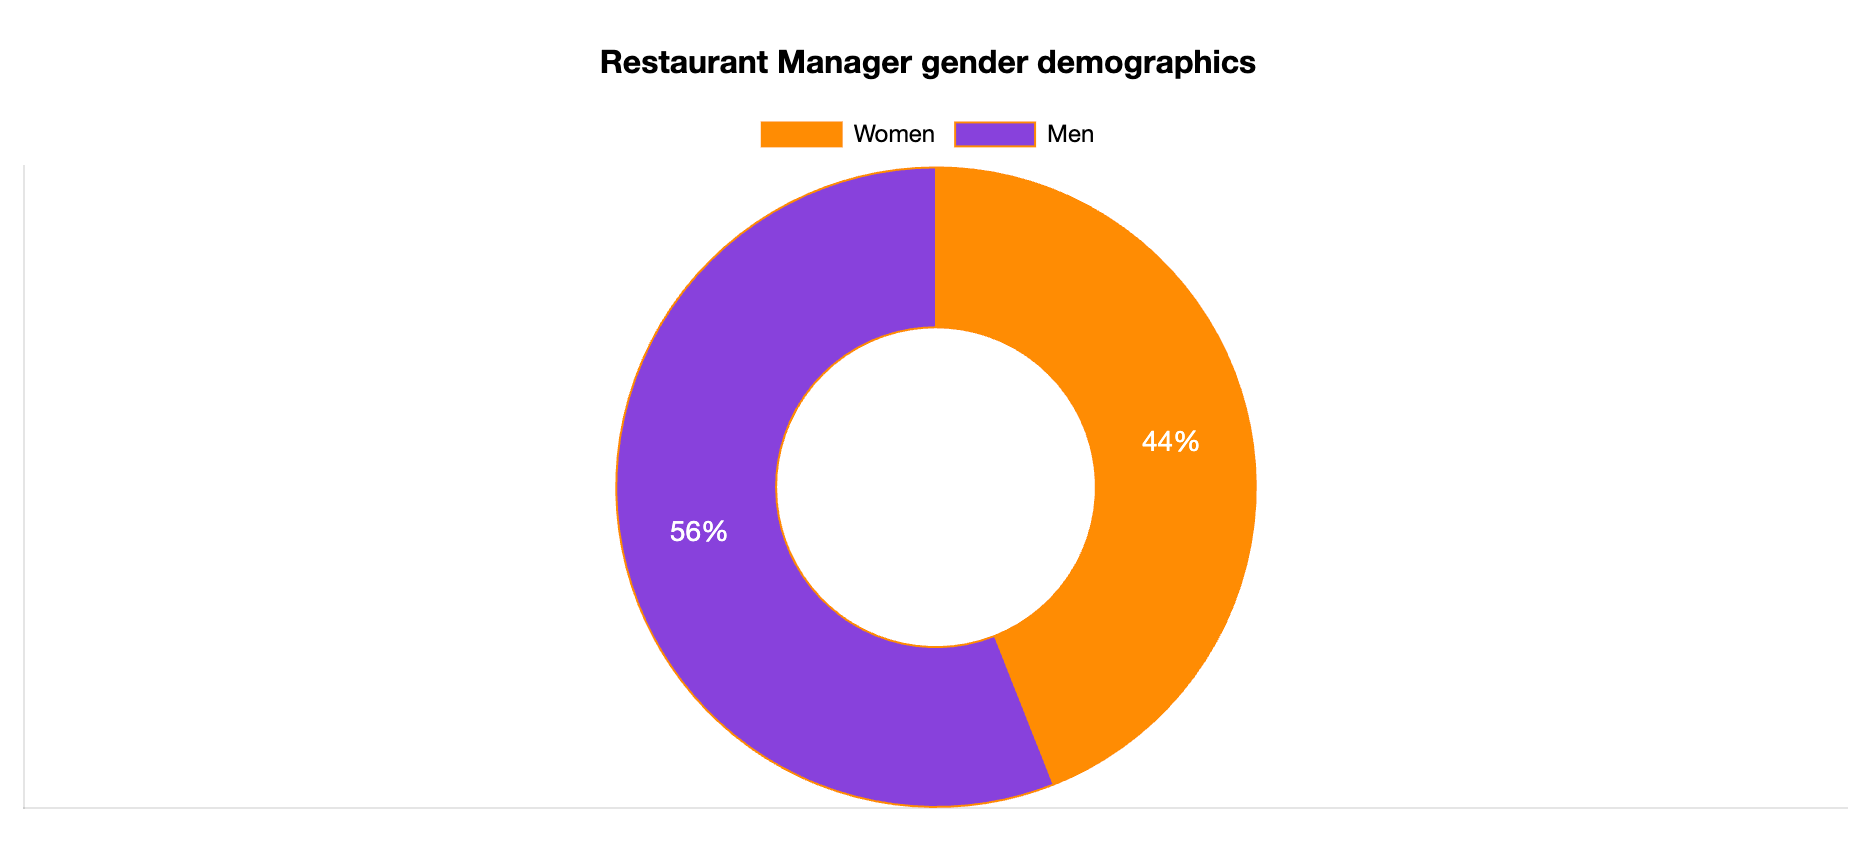
There is a 12% higher percentage of male Restaurant Managers (56%) compared to women (44%).
Restaurant Manager Age Demographics: Seniority and Experience
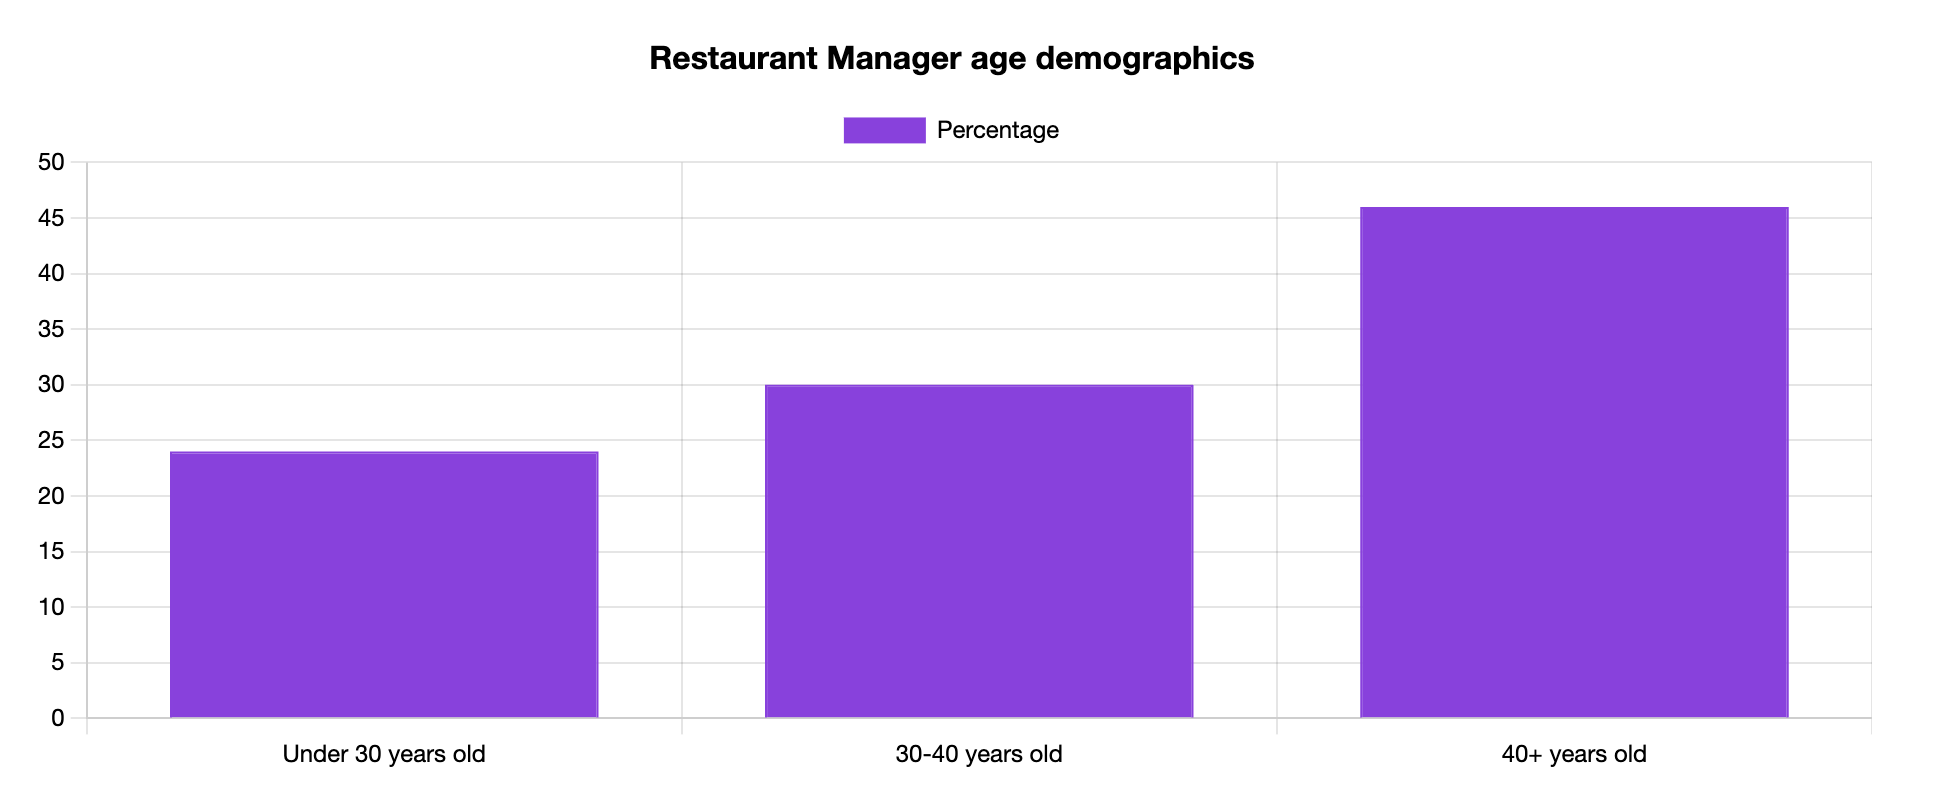
Considering this is a senior role, it doesn’t come as a surprise that the majority of Restaurant Managers (46%) are older than 40 whilst 24% are younger than 20.
This is in stark contrast with Restaurant Consultant demographics, where only 3% of individuals are older than 40.
Full-Time vs. Part-Time Restaurant Manager Employment
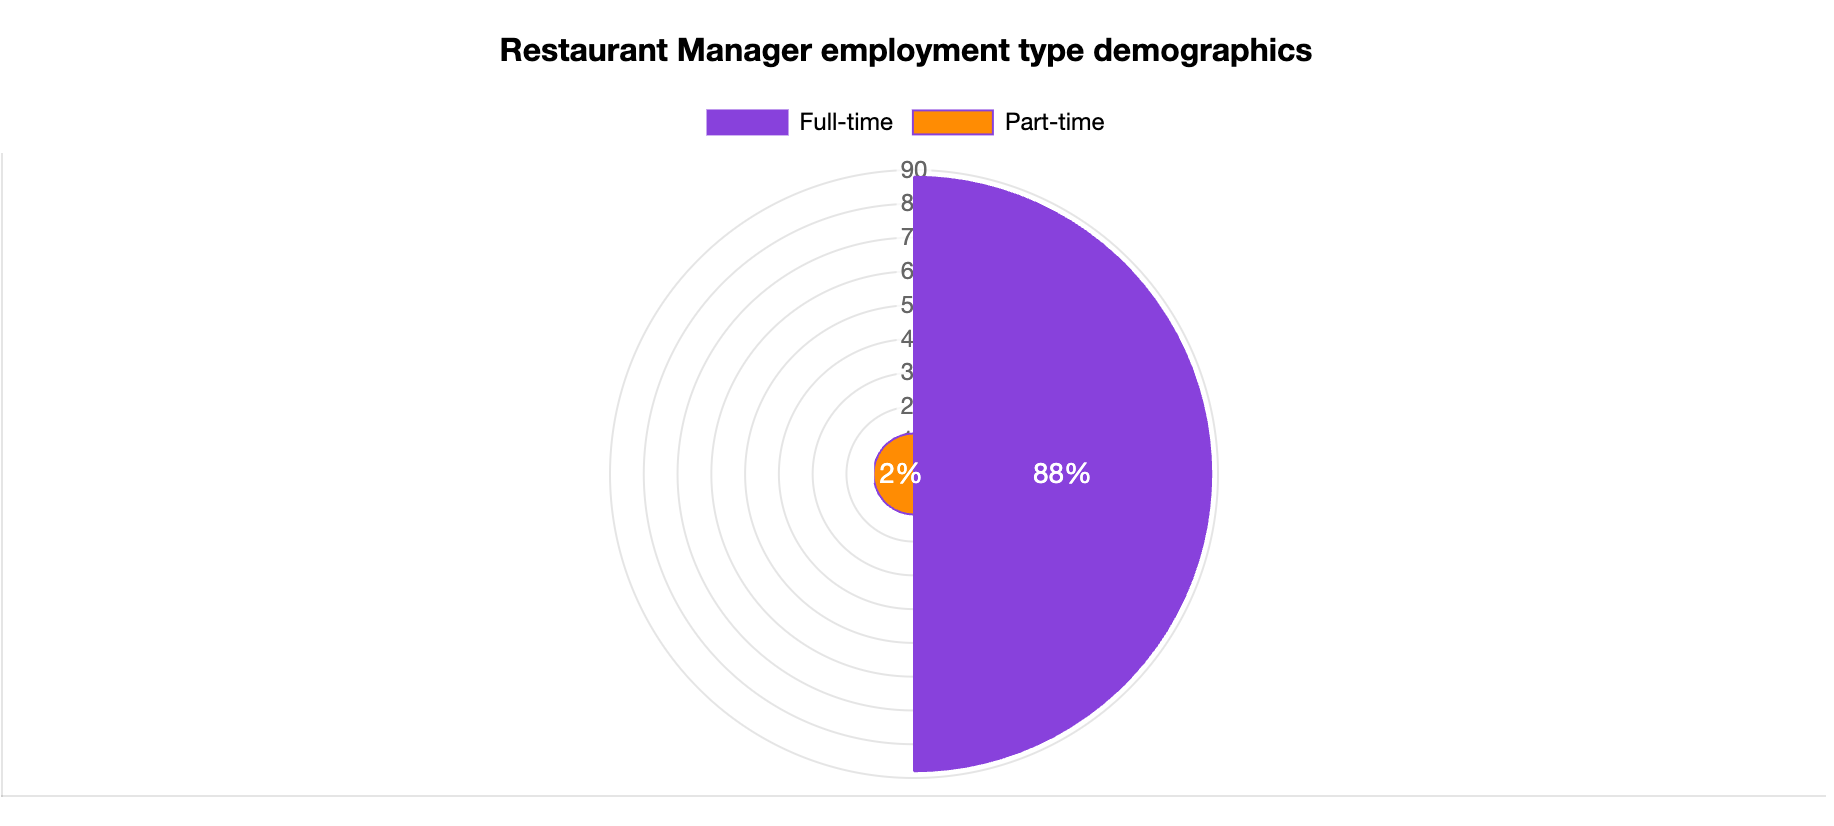
Given that managing a restaurant is a complex and challenging task, 88% of Restaurant Managers work full-time, while only 12% are hired as part-time employees.
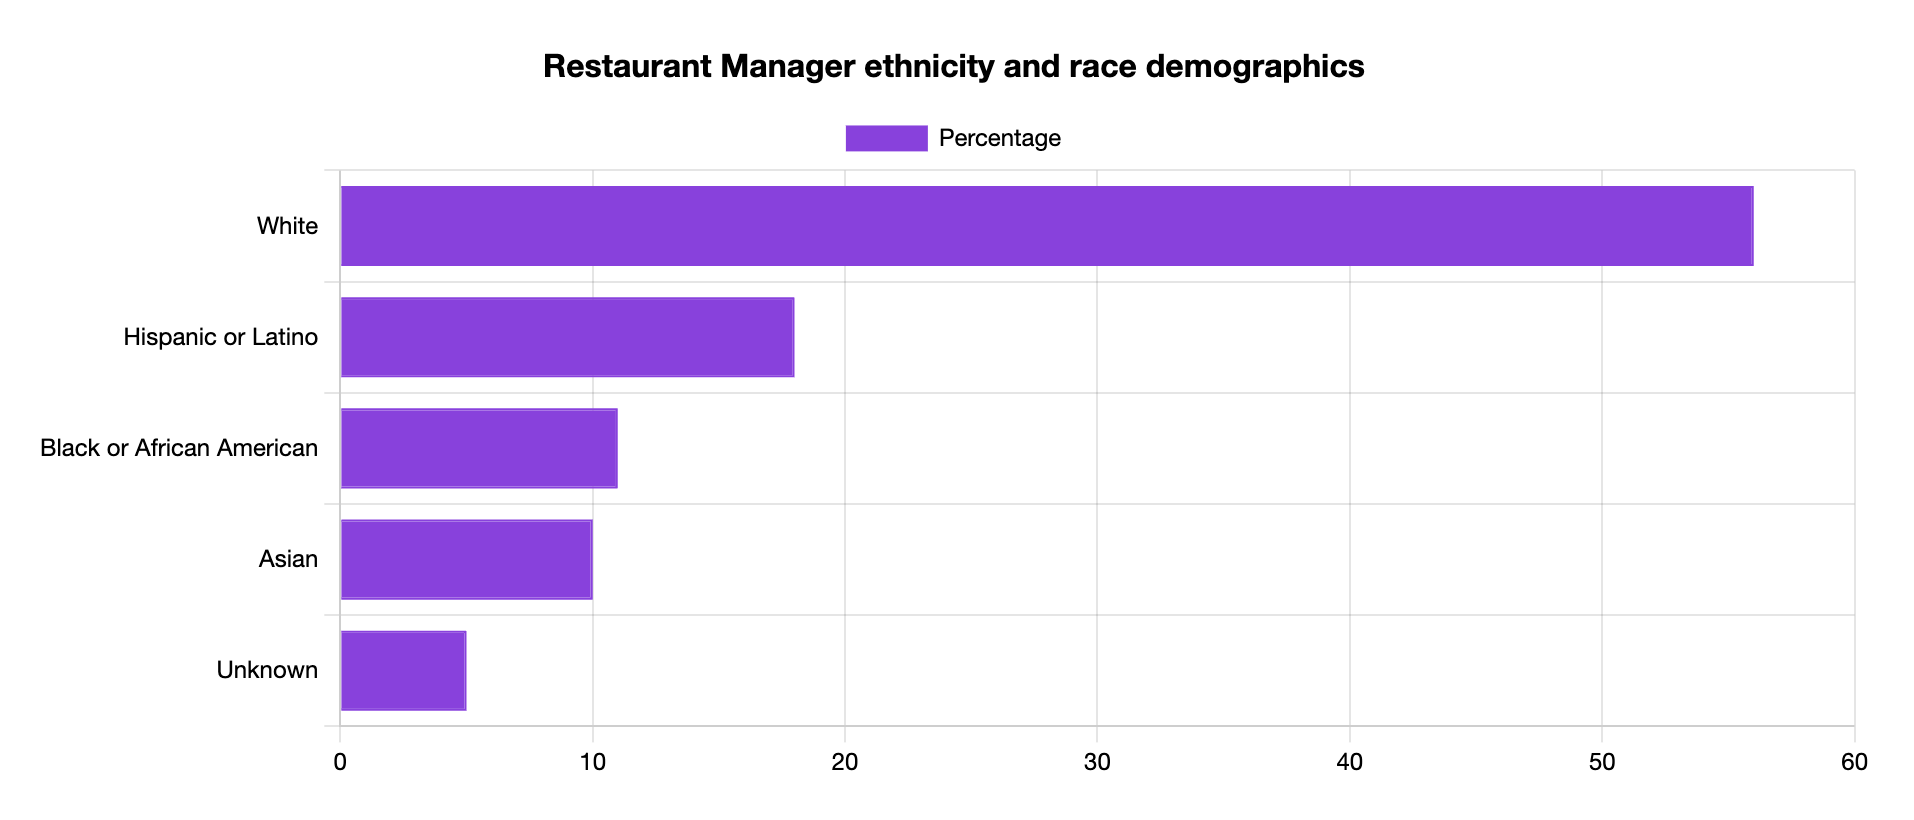
Ethnicity and Race in the Restaurant Manager Workforce
The percentage of white Restaurant Managers (56%) is more than double that of those of Hispanic descent, the second largest ethnicity in the field.
This breakdown by race and ethnicity is similar to other hospitality roles, as you can see on our Hotel Manager demographics page.
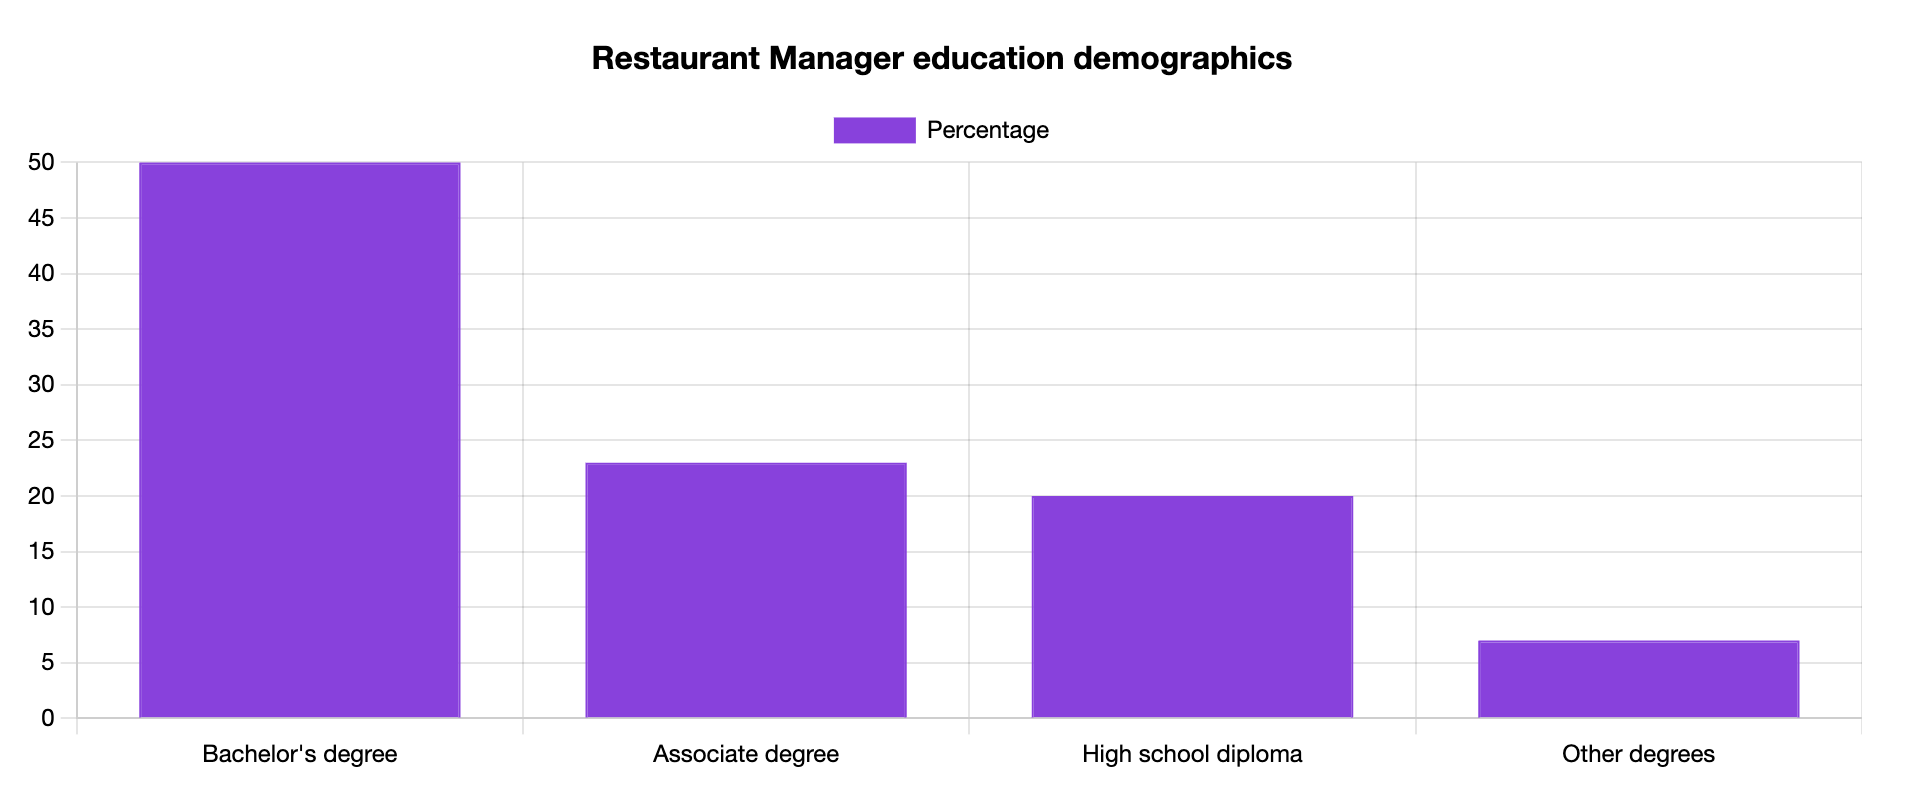
Educational Attainment for Restaurant Managers
To manage a restaurant effectively, most Restaurant Managers (50%) opt for a bachelor's degree, where they learn the ins and outs of hospitality and customer service.
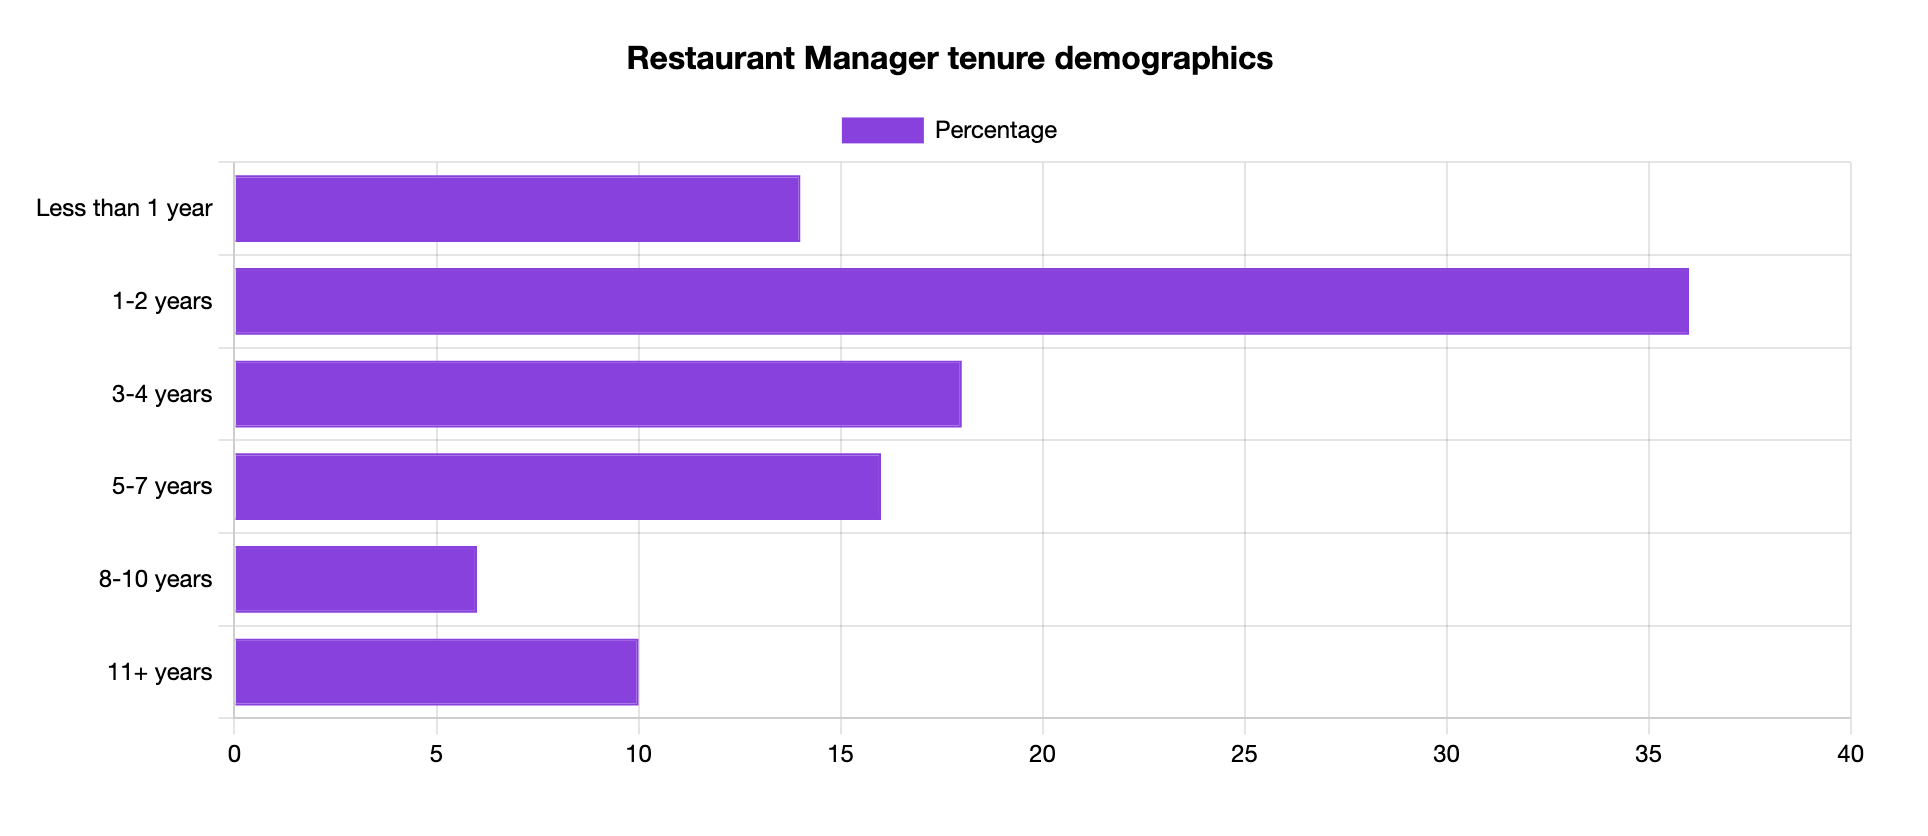
Tenure and Turnover Rates Among Restaurant Managers
36% of Restaurant Managers only remain in the role for one to two years. This indicates two things — first, great opportunities for career advancement in the field; second, high market demand for managers in hospitality.
Industry Breakdown: Where Do Restaurant Managers Work?
As expected, the highest number of Restaurant Managers (181,690) are employed at restaurants and other eating places, followed by special food services, including catering, food trucks and Personal Chef services.
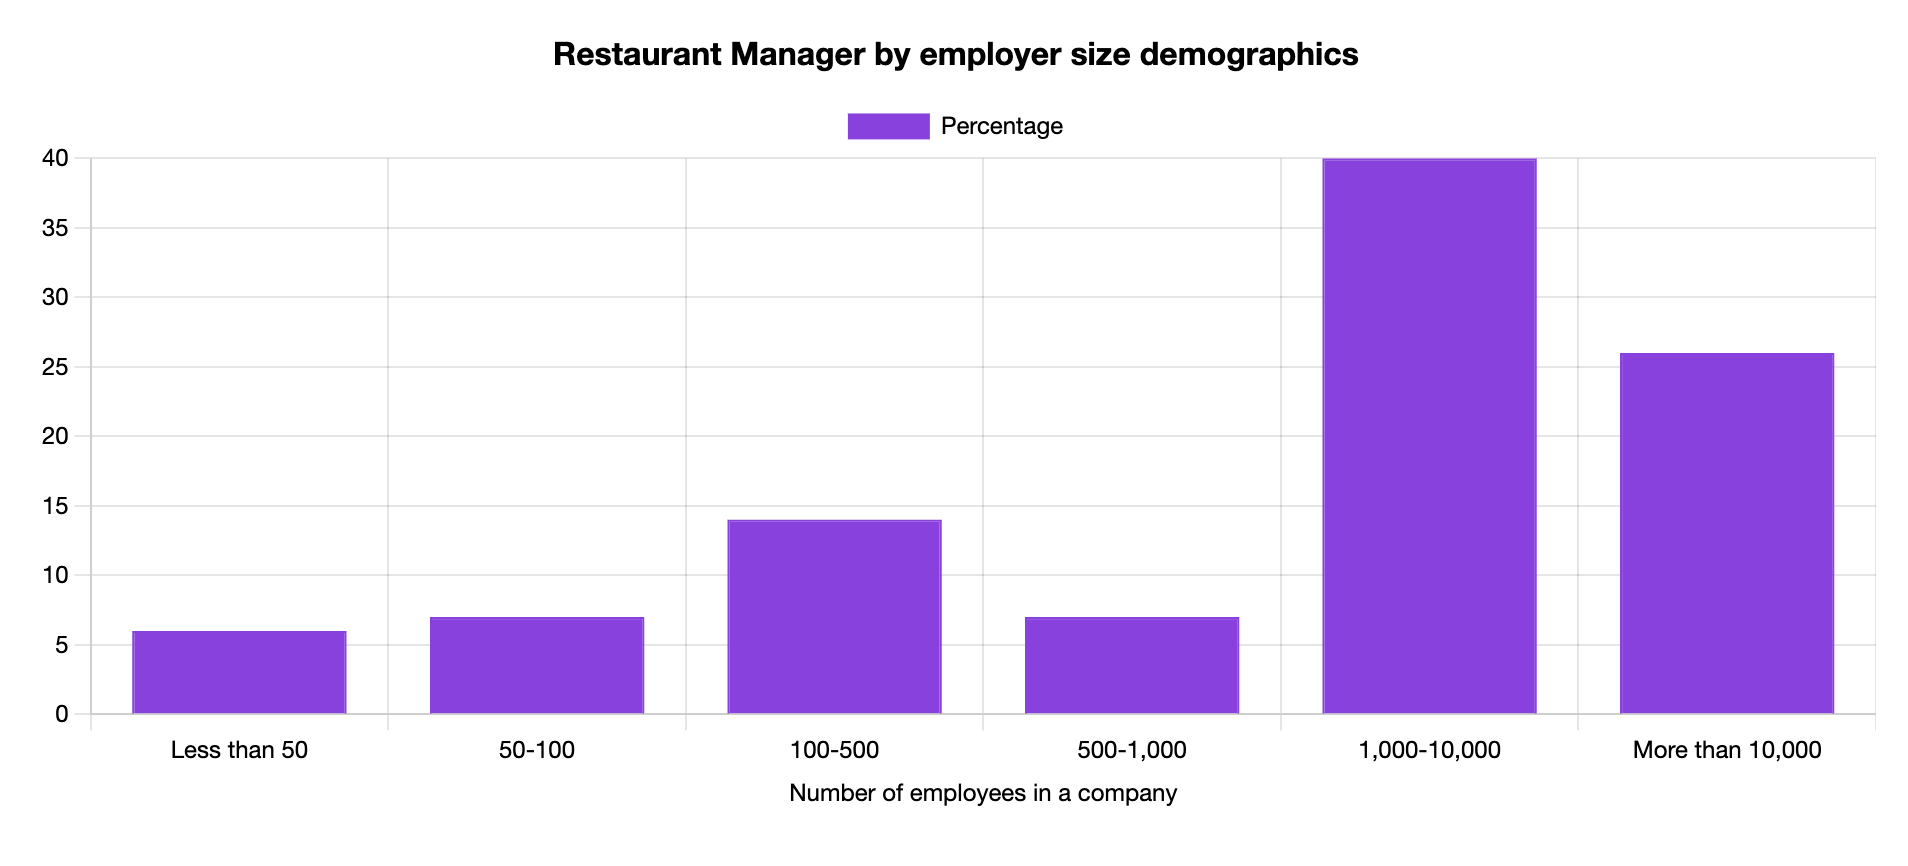
Company Size and Organizational Structures for Restaurant Managers
The overwhelming majority (66%) of Restaurant Managers work in large-scale restaurants that have 10,000 or more staff members.
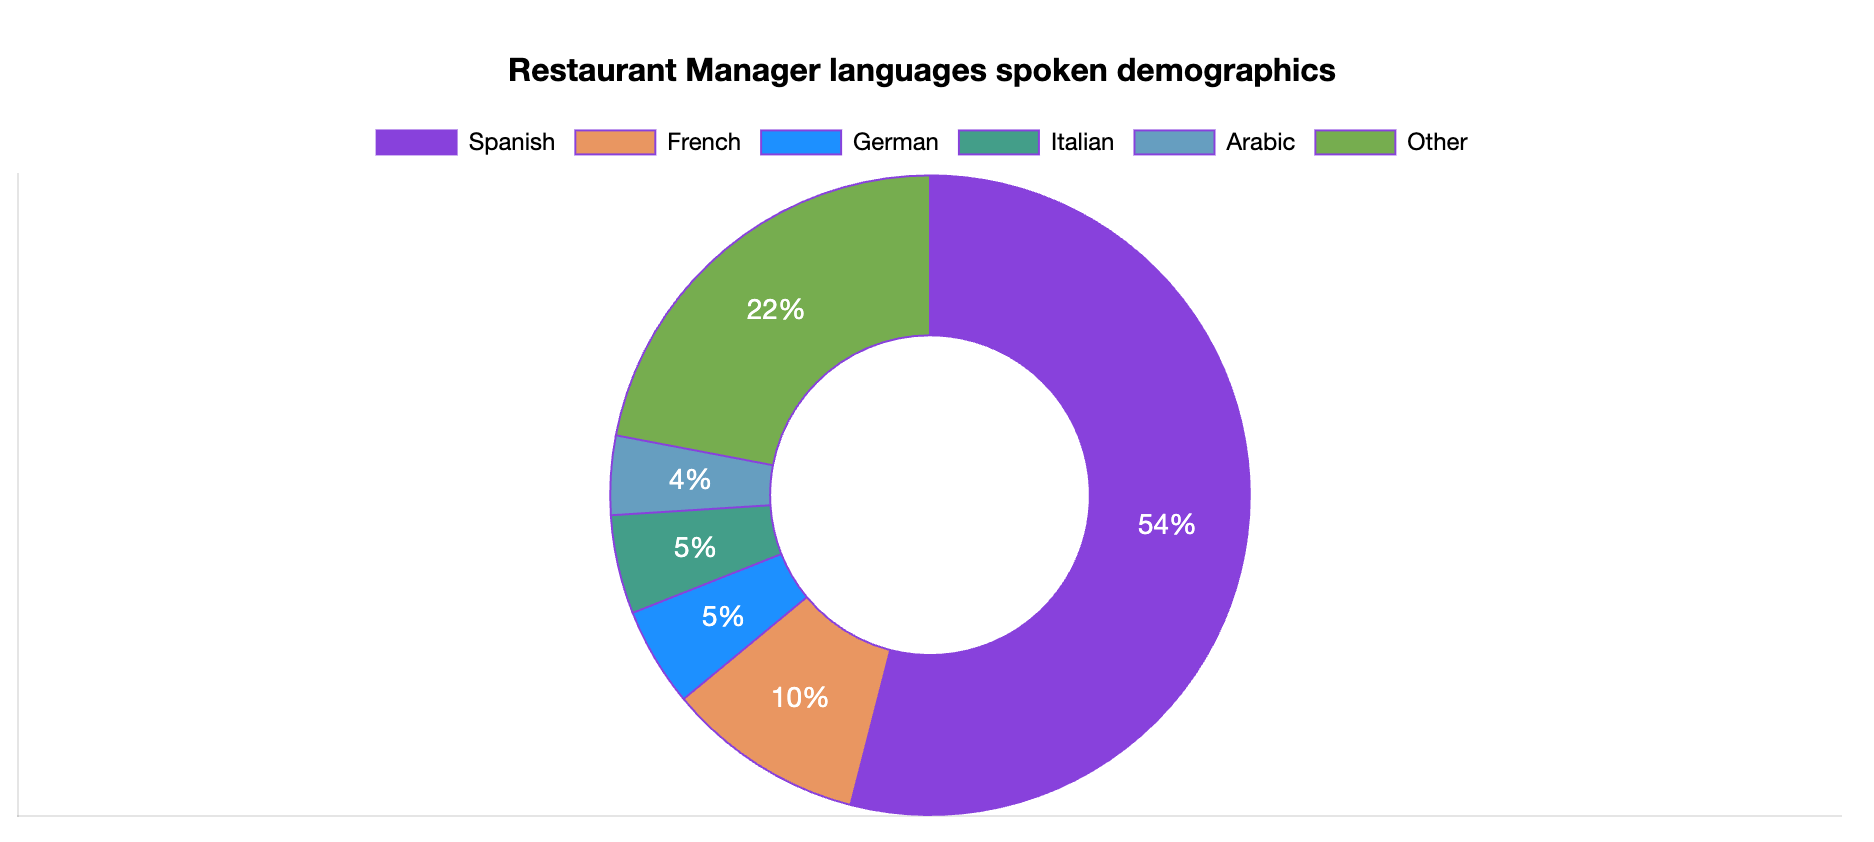
Languages Spoken by Restaurant Managers: Multicultural Workforce
Spanish is the leading language among Restaurant Managers, as 54% of those who speak a second language are fluent in it. Other popular languages include French, Italian, German and Arabic.
Restaurant Manager Statistics and Demographics Data
Here at OysterLink, we’ve developed our own demographics and statistics methodology that we use to ensure our data is always accurate and relevant.

Reviewed by Stefan Petrov
With over 10 years of experience as a writer and editor, Stefan has worked in the automotive, IT, health and hospitality industries. Familiar with Google Search Console and other SEO tools like Ahrefs and Semrush, Stefan uses his experience to create content that's visually appealing to the user but also ranks in the SERPs.