Porter Demographics and Statistics in the US – 2026
We’ve collected Porter statistics and demographics in the United States.
Below, you can see how educated they are, how long they stay with the same employer, the languages they speak and more.
- The average salary for a Porter in the United States is $36,100 a year without tips
- The salary of Porters in Miami is $33,640 per year on average
- New York City Porters’ salary is $47,590 per year on average
- Top earners (90th percentile) in the Porter role in the United States make $47,610 per year
- Bottom earners (10th percentile) in this role make $24,710 per year
Porter Employment Statistics
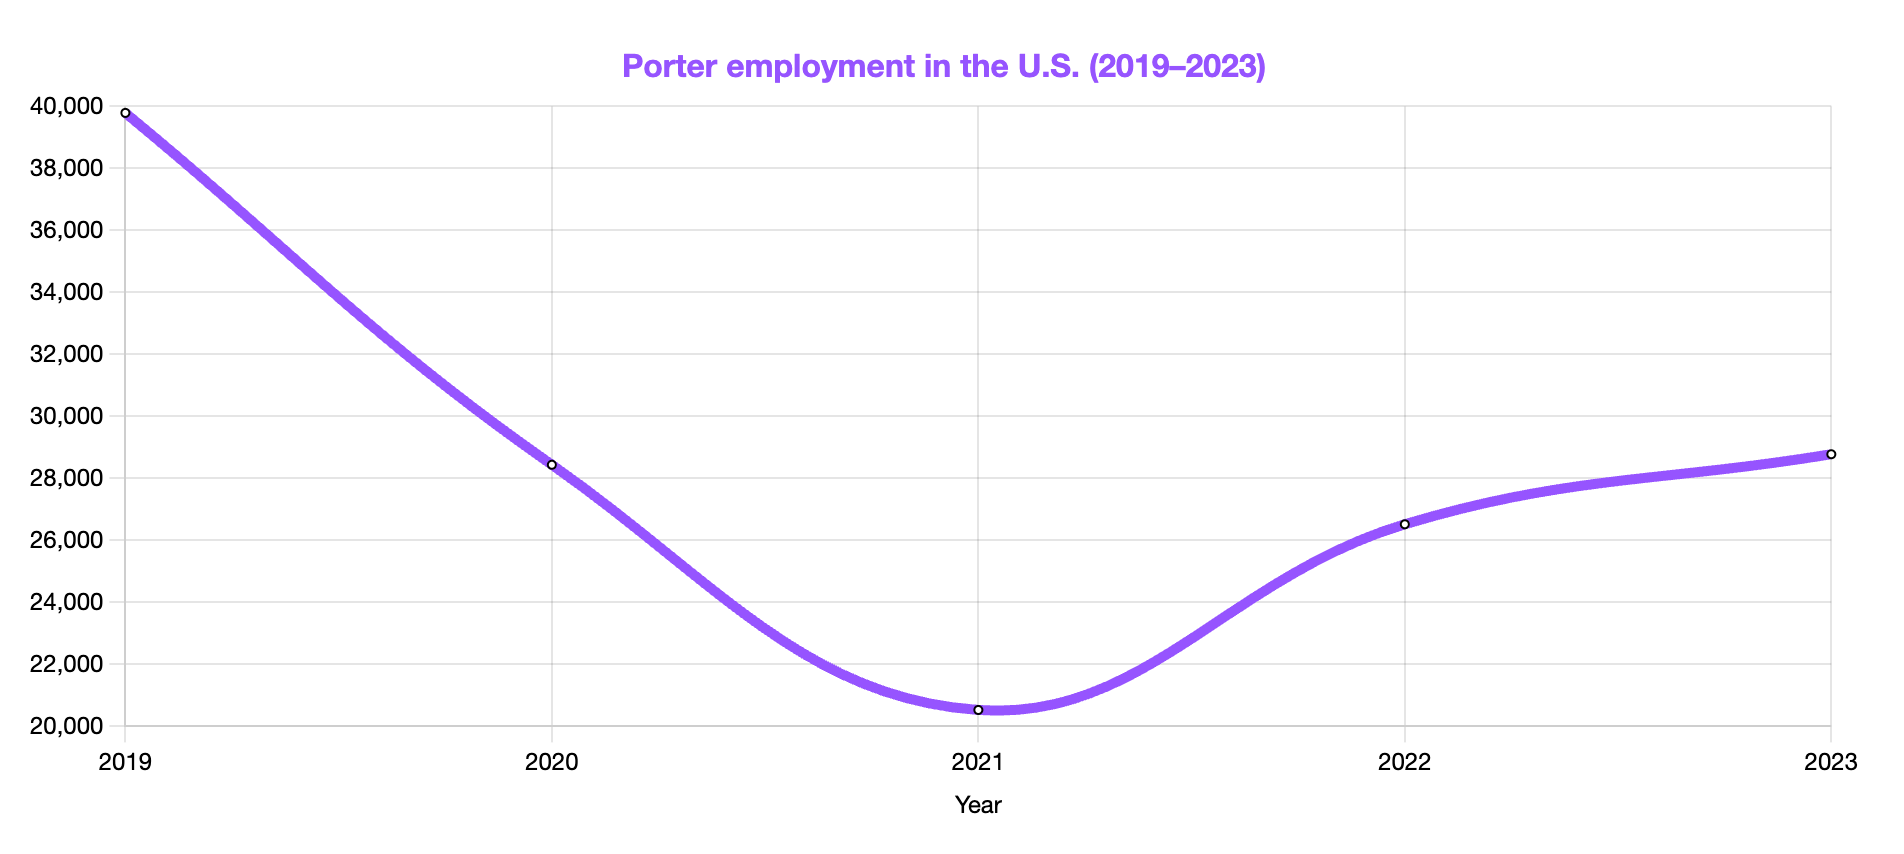
In the below graph, you can see how Porter employment changed over the years in the United States, according to the Bureau of Labor Statistics.
You can see that there was a steep drop off in 2021, and the number of Porter jobs in the United States still hasn’t returned to the pre-pandemic levels.
Porter Gender Statistics
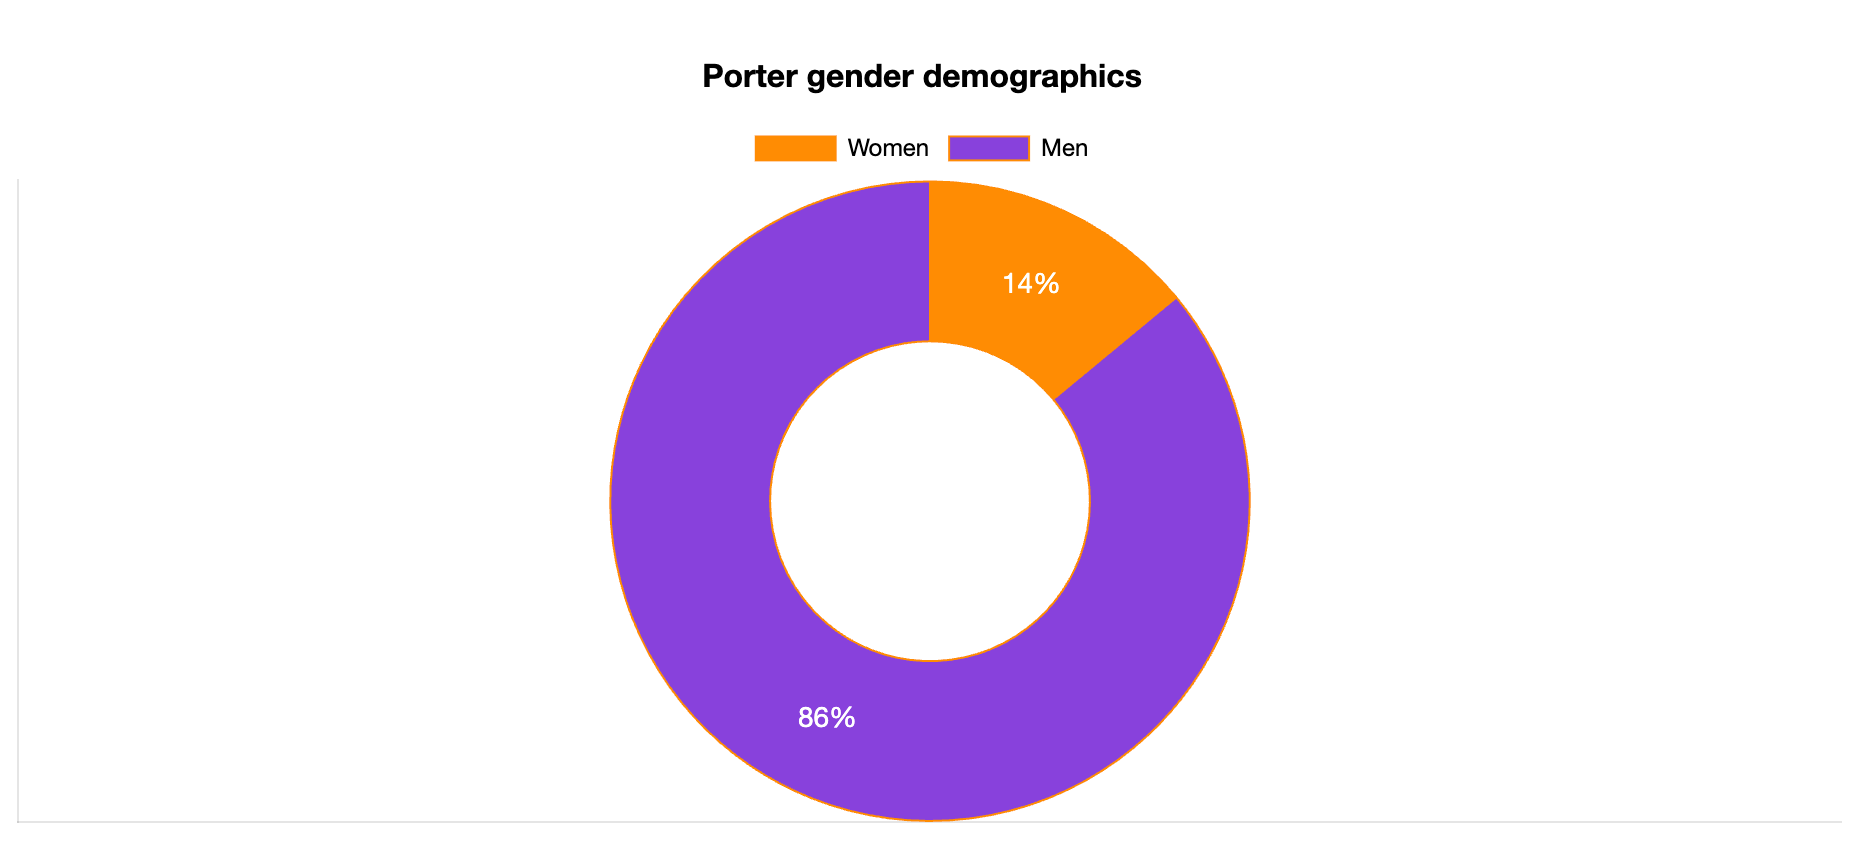
Only 14% of all Porters are women, so this is a male-dominated role. Another role with similar gender statistics is the Valet, as you can see on our Valet demographics page.
Porter Age Statistics
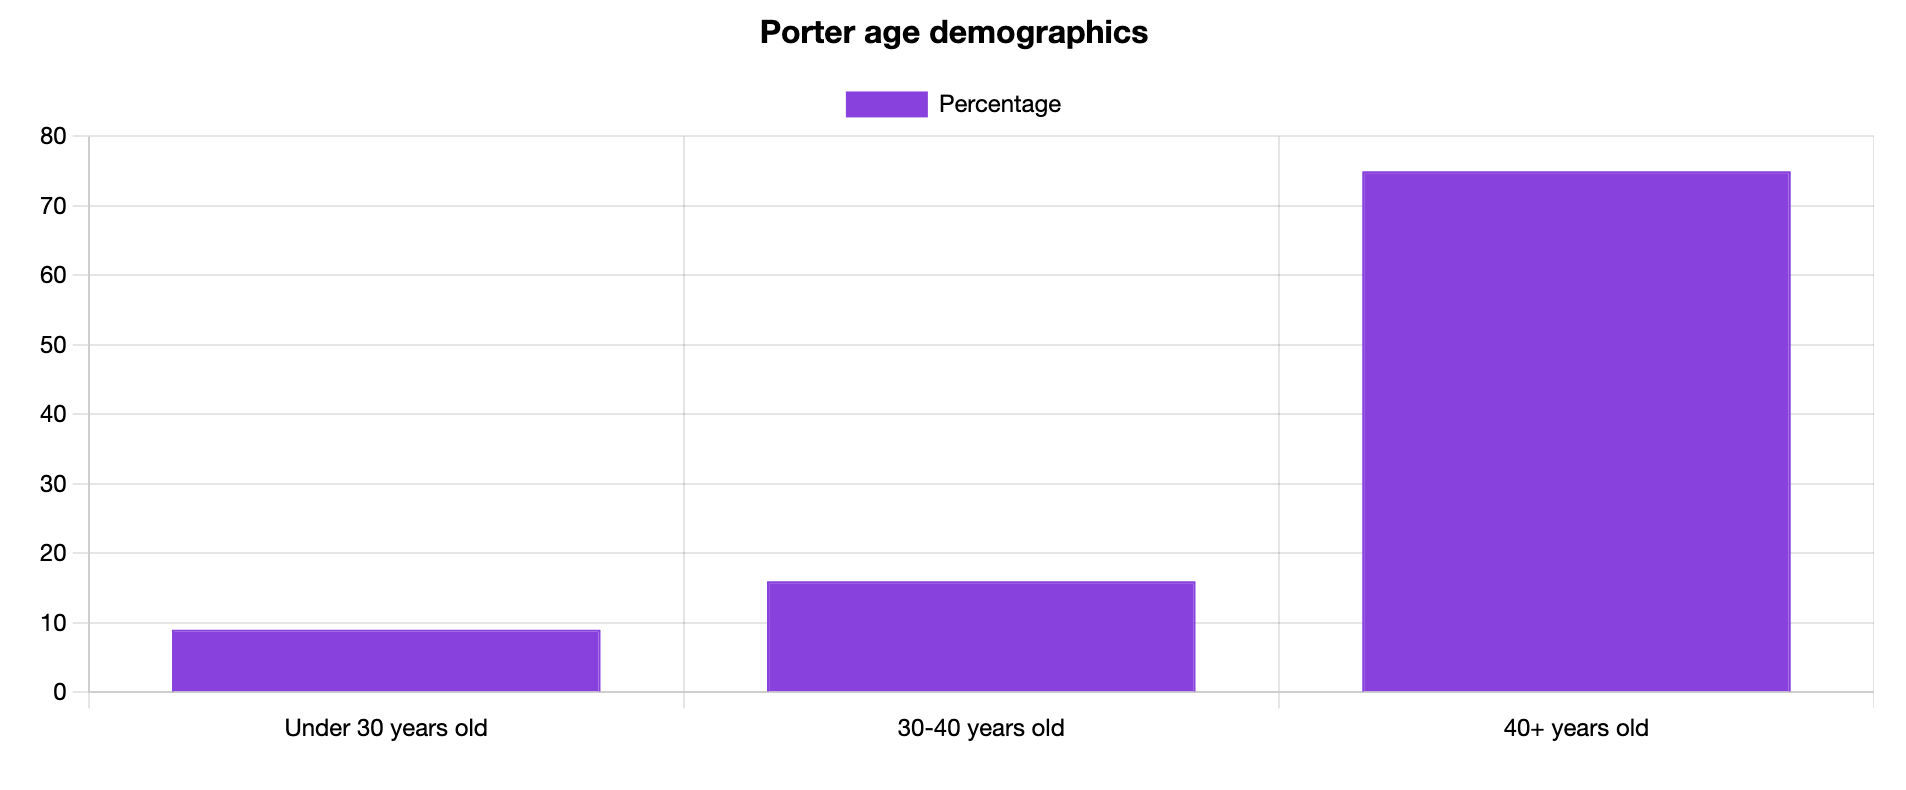
Most Porters are older than 40, 16% of them are between 30 and 40 years old, while 9% of them are between 20 and 30 years old.
Another role that employs mostly individuals who are above 40 is the Housekeeper. Explore our Housekeeper demographics to learn more.
Porters Ethnicity and Race Statistics
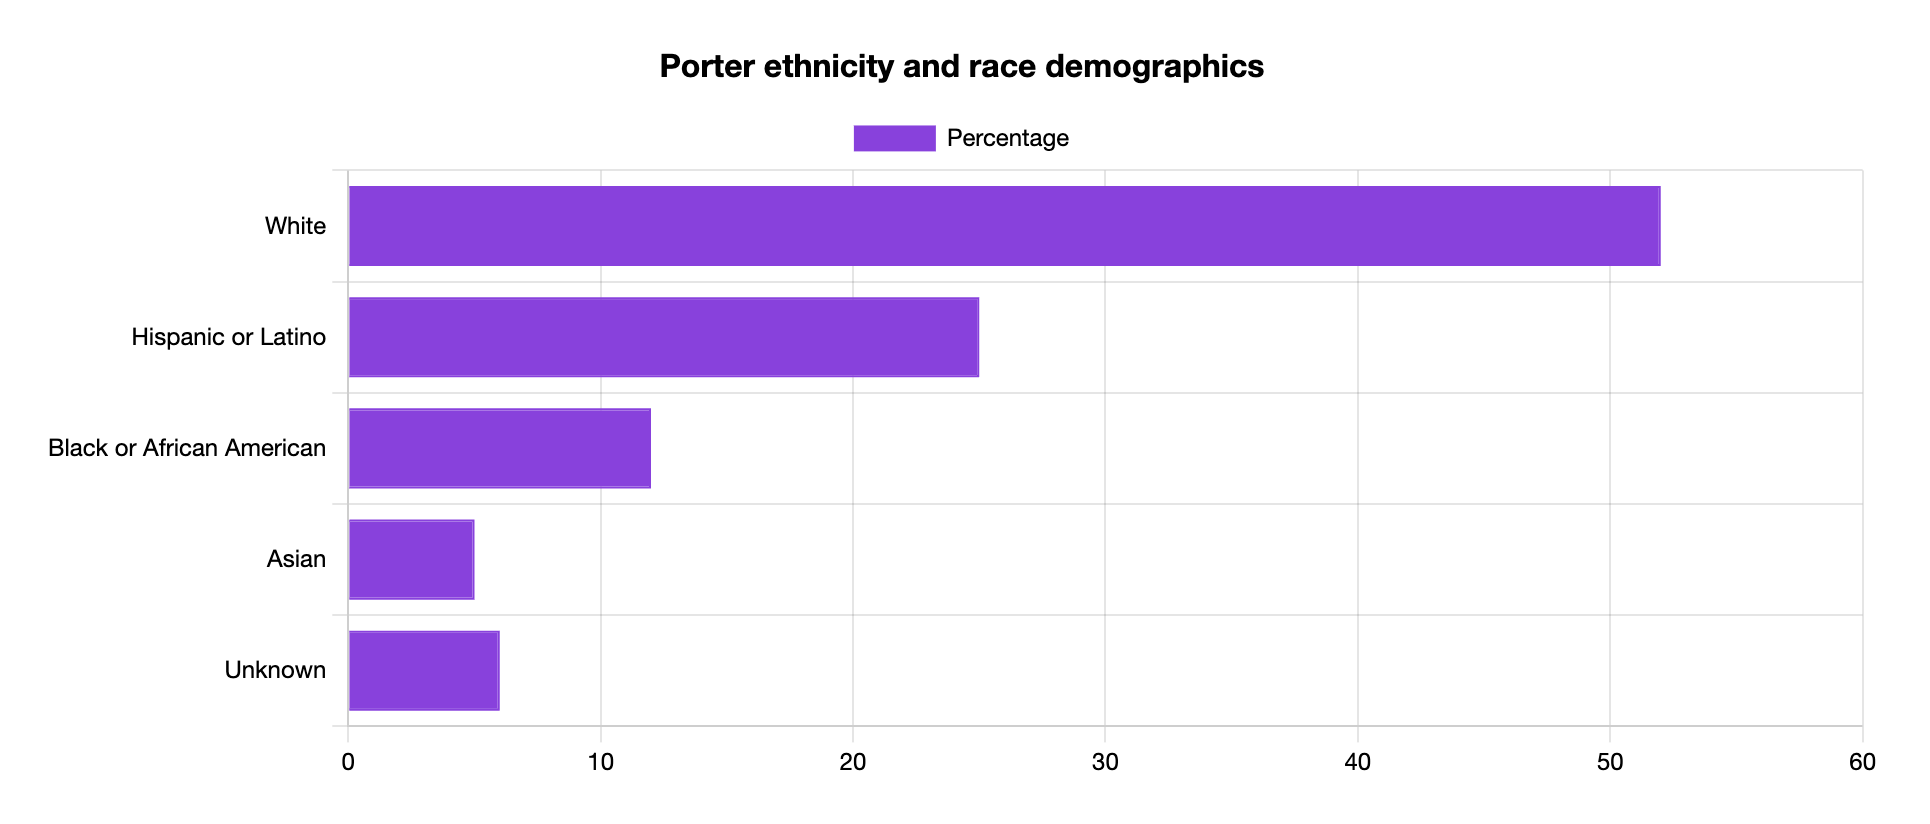
Most Porters are white, followed by Hispanic and Latino Porters (25%) and Black or African American Porters 12%.
See the breakdown of Porters by race and ethnicity below.
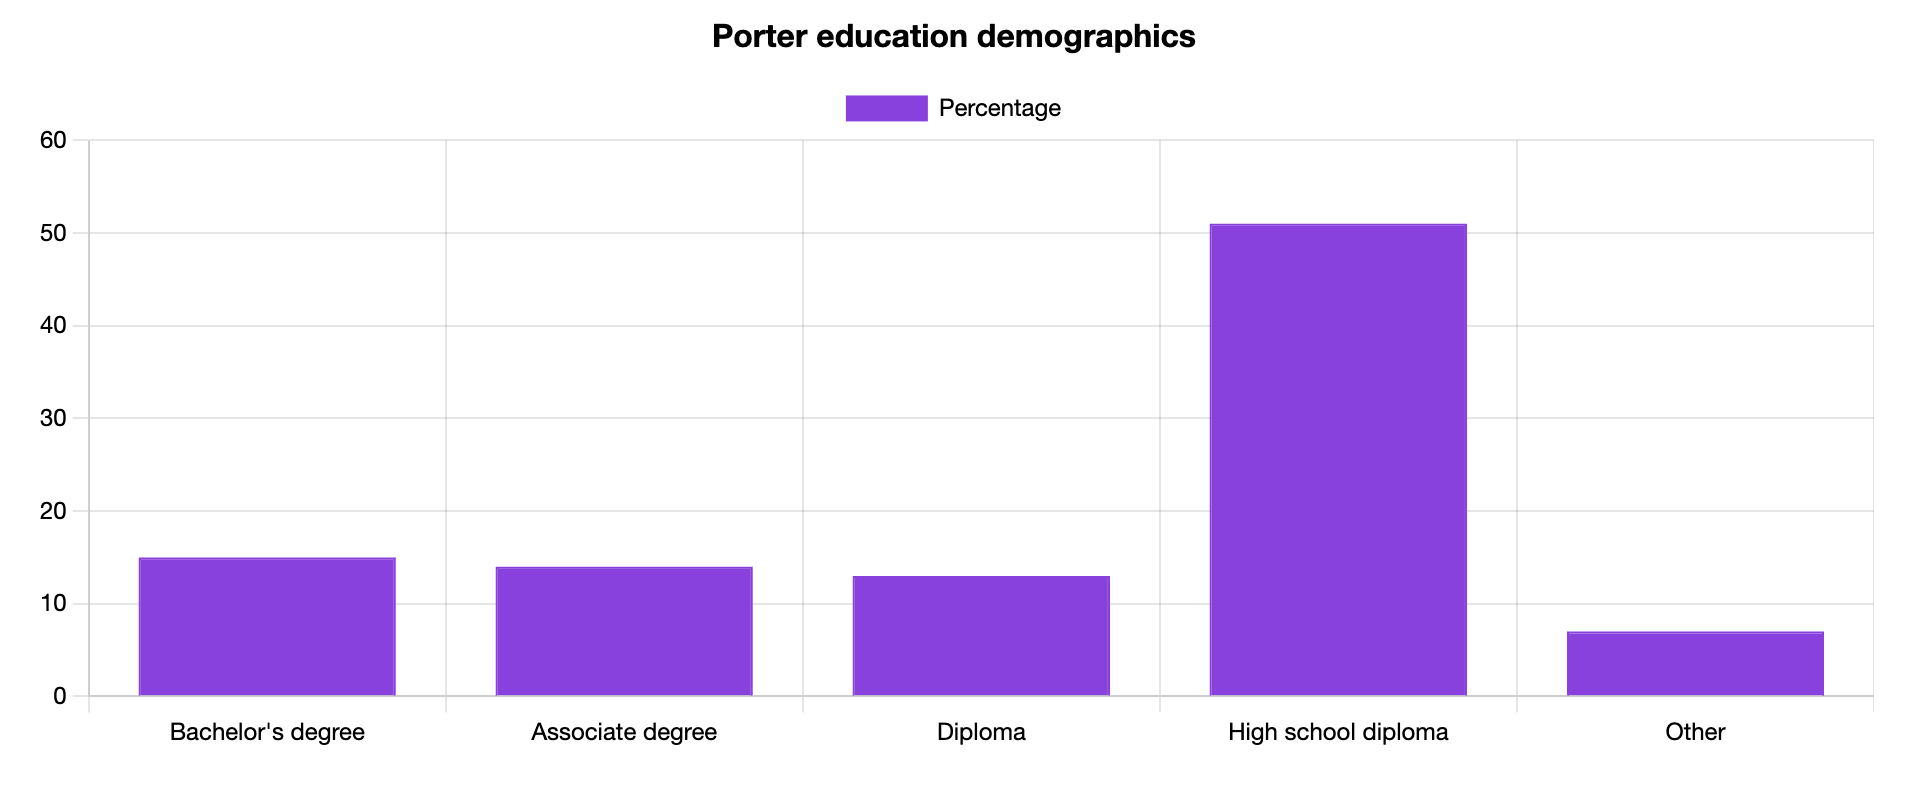
Porter Education Statistics
As an entry-level role, Porters don’t typically have extensive educational requirements.
Most Porters have a high school diploma (51%), but there are also individuals who have a bachelor’s degree (15%).
The hospitality industry has numerous roles that don't require extensive education. You can learn more on our Food Runner demographics page.
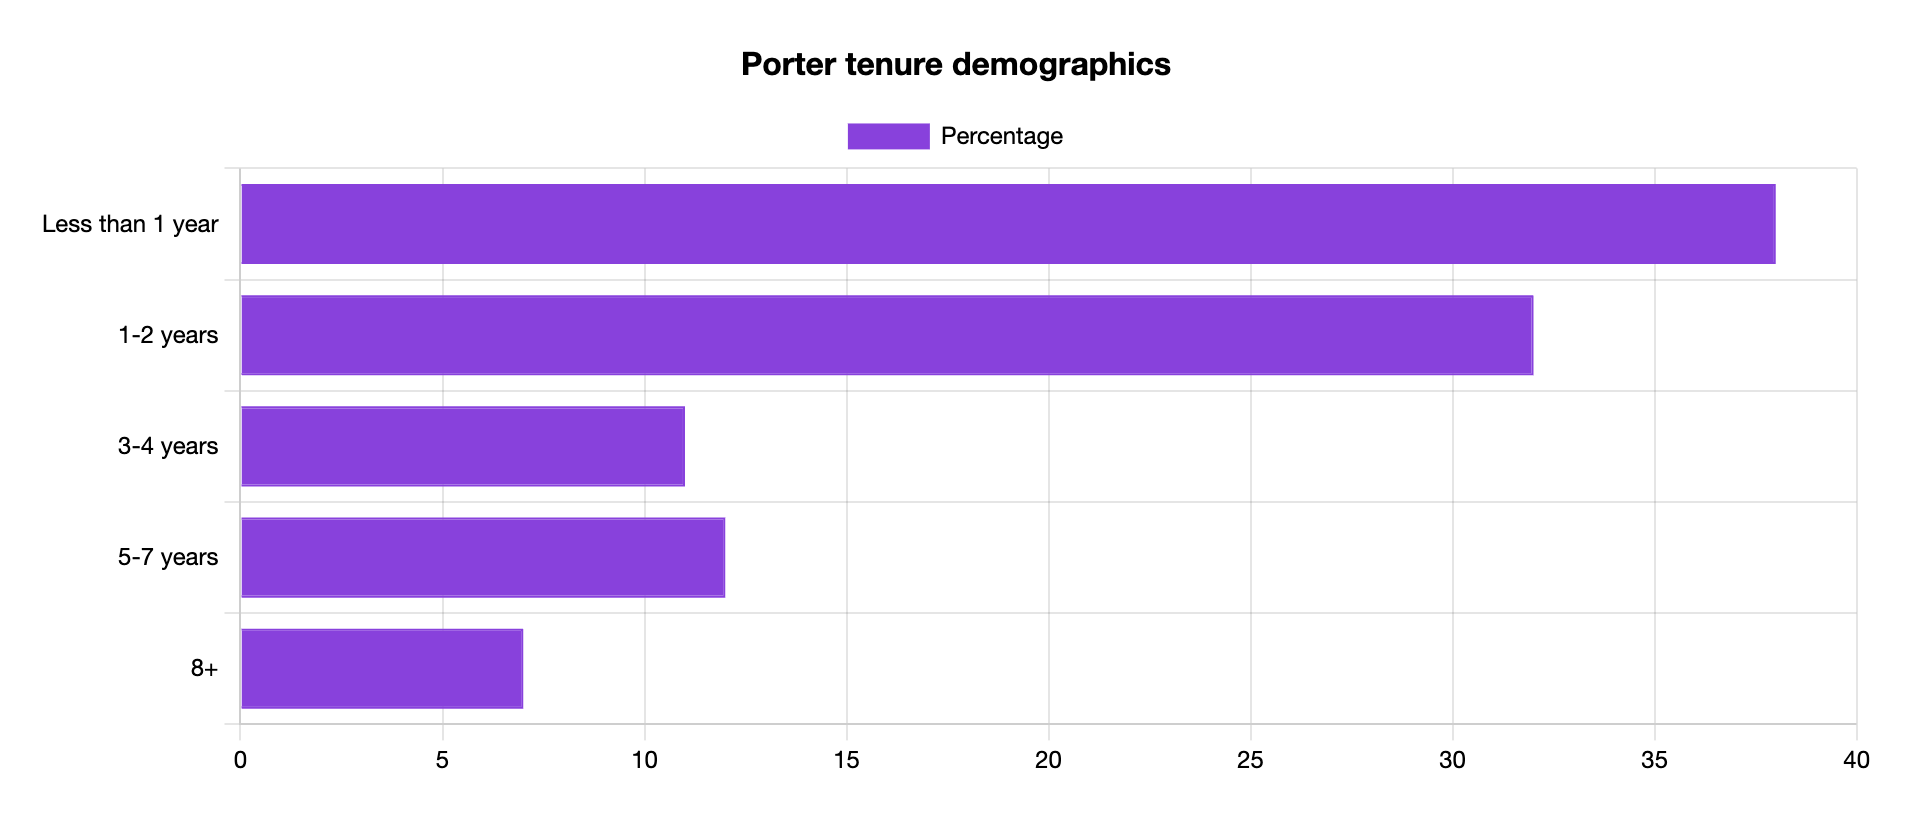
Porter Tenure Statistics
Most individuals who work as Porters in the United States stay at the same job for less than one year (38%).
Given that turnover rates in hospitality are high, it is understandable that only 7% of all Porters stay at the same job for more than eight years.
Porter Industry Statistics
Porters can work across industries in numerous establishments.
See the industries that employ the most Porters in the table below:
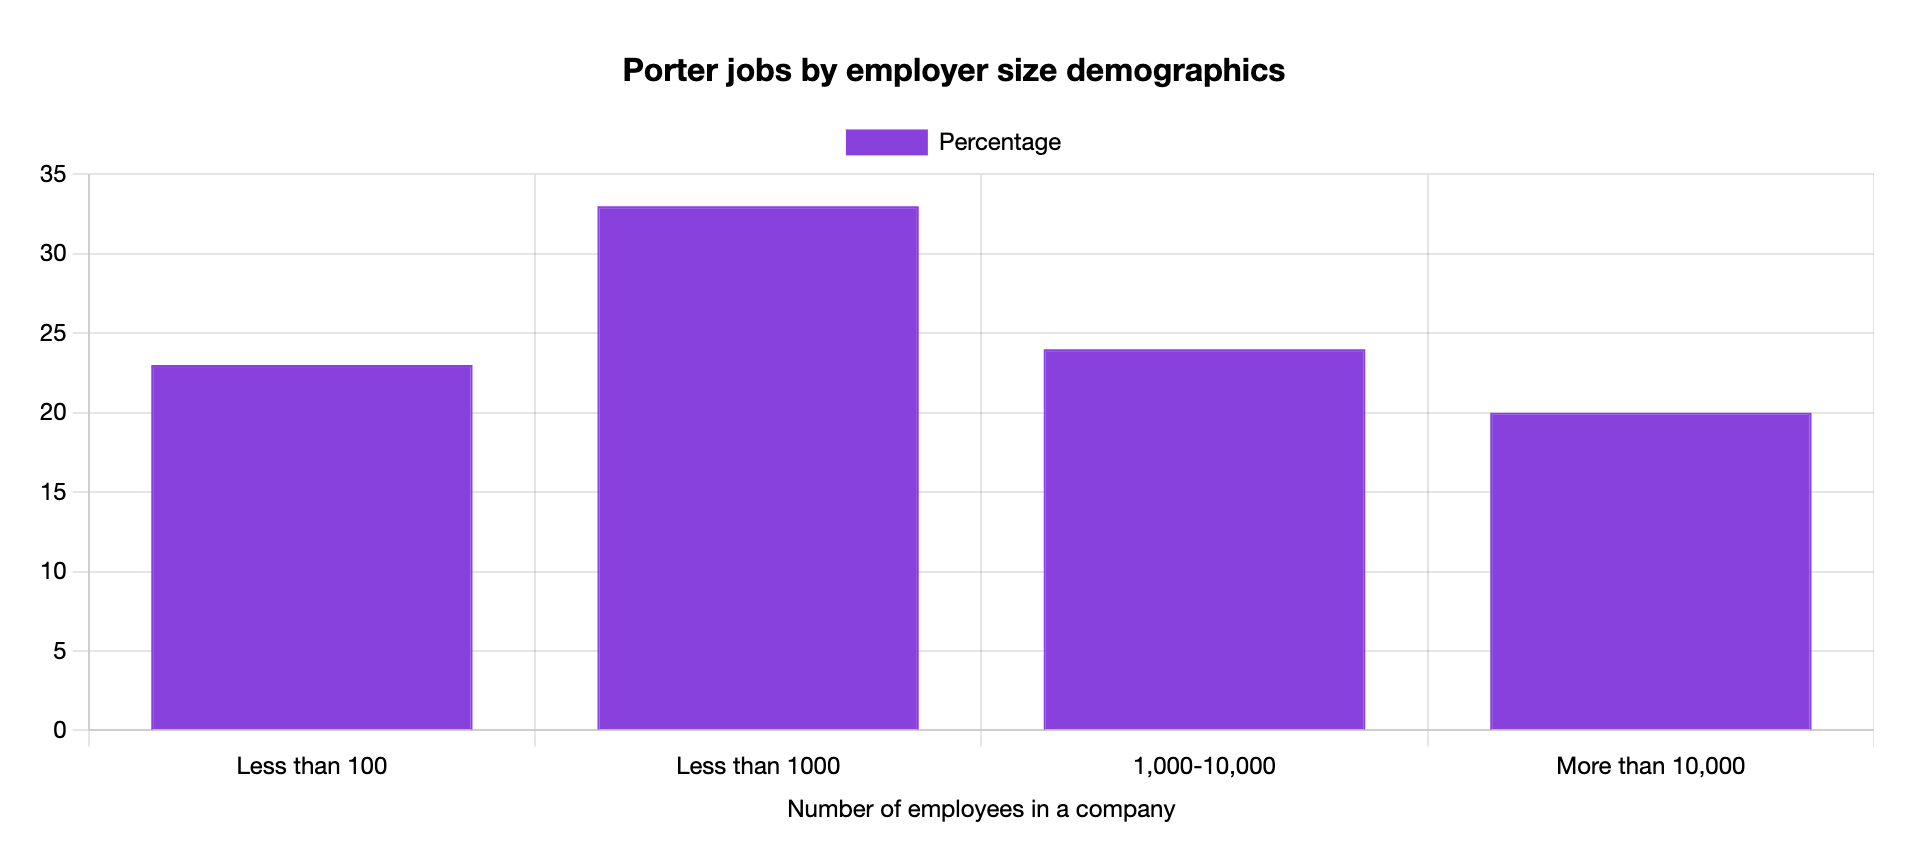
Porter Jobs by Company Size
Considering that Porters work across industries, it also means that they can be found in companies of various sizes.
While most Porters work in companies that have between 1,000 and 10,000 people, there are those who work for employers with less than 50 employees.
See the breakdown of Porter jobs by company size below.
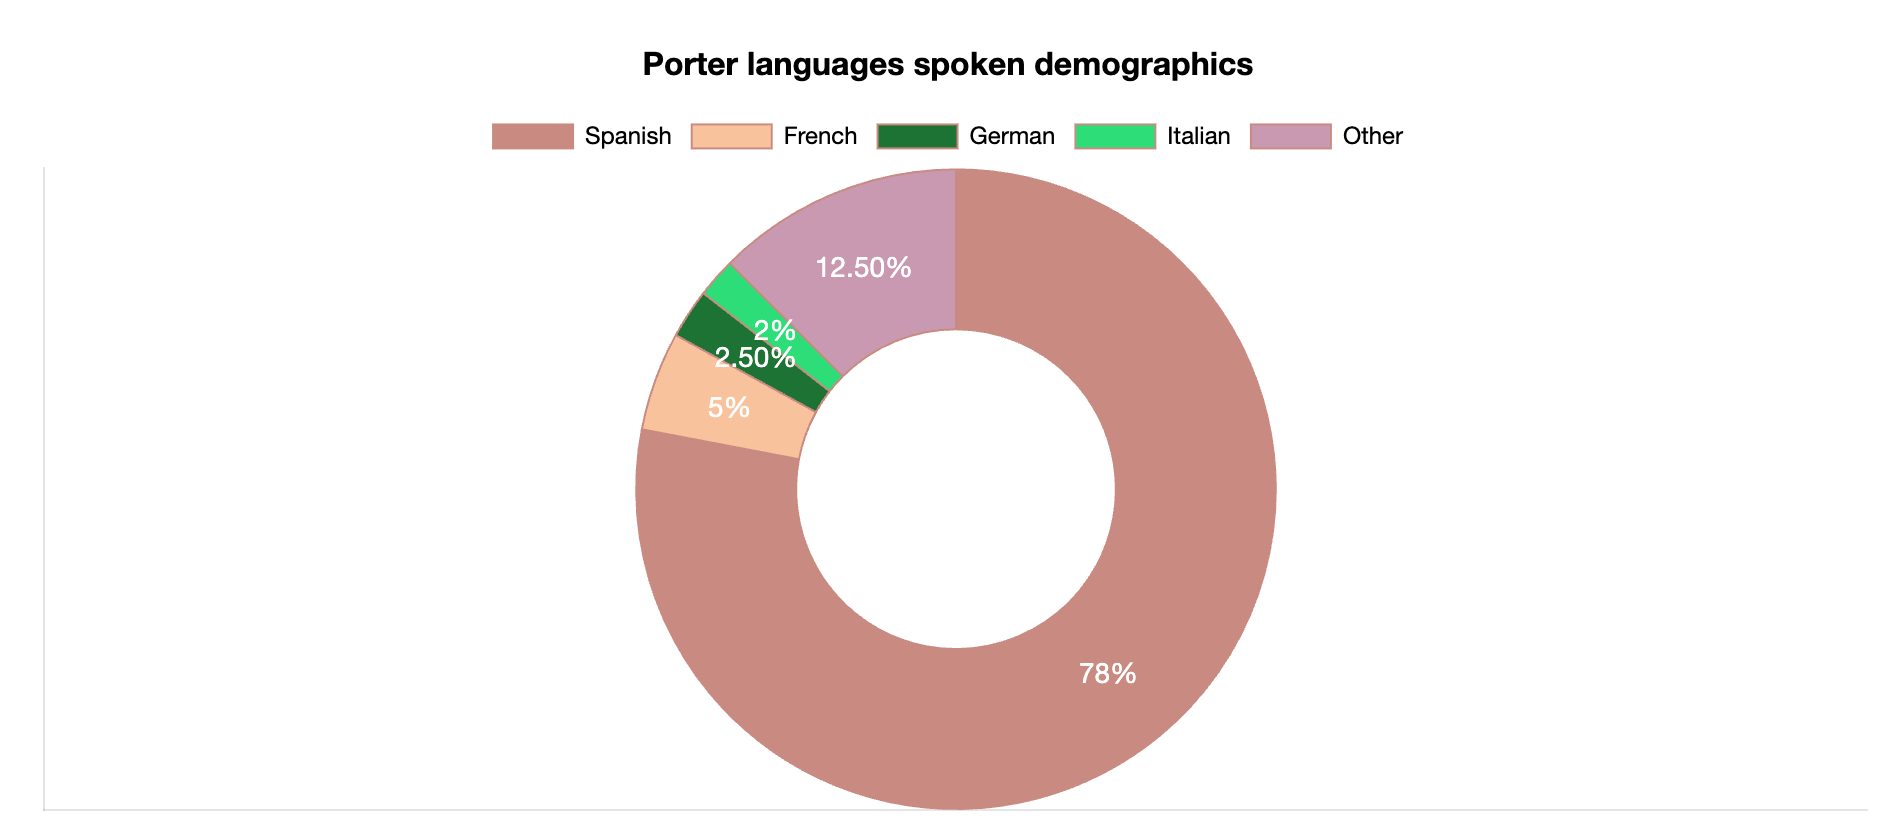
Porter Languages Spoken
Porters in the United States speak English and a good portion of them speak a second language as well.
While Spanish is the most popular second language for Porters, they also speak French, Italian, German and more.
Additional Porter Statistics
- 33% of all Porters work in companies that employ between 1,000 and 10,000 people
- 86% of all Porters are men
- Most Porters (75%) are older than 40 years
- 52% of all Porters are white
- 78% of all Porters who know a second language can speak Spanish
Porter Statistics and Demographics Data
We collect our data from government and agency sources.
See how we do it on our statistics and demographics methodology page.

Reviewed by Stefan Petrov
With over 10 years of experience as a writer and editor, Stefan has worked in the automotive, IT, health and hospitality industries. Familiar with Google Search Console and other SEO tools like Ahrefs and Semrush, Stefan uses his experience to create content that's visually appealing to the user but also ranks in the SERPs.