Head Chef Demographics and Statistics in the US – 2026
If you’re looking to start your career as a Head Chef or are looking to find some interesting Head Chef statistics and demographics, you came to the right place.
We’ve collected some of the top industry trends for this role to help you gain valuable insights and a deeper understanding of what this role entails.
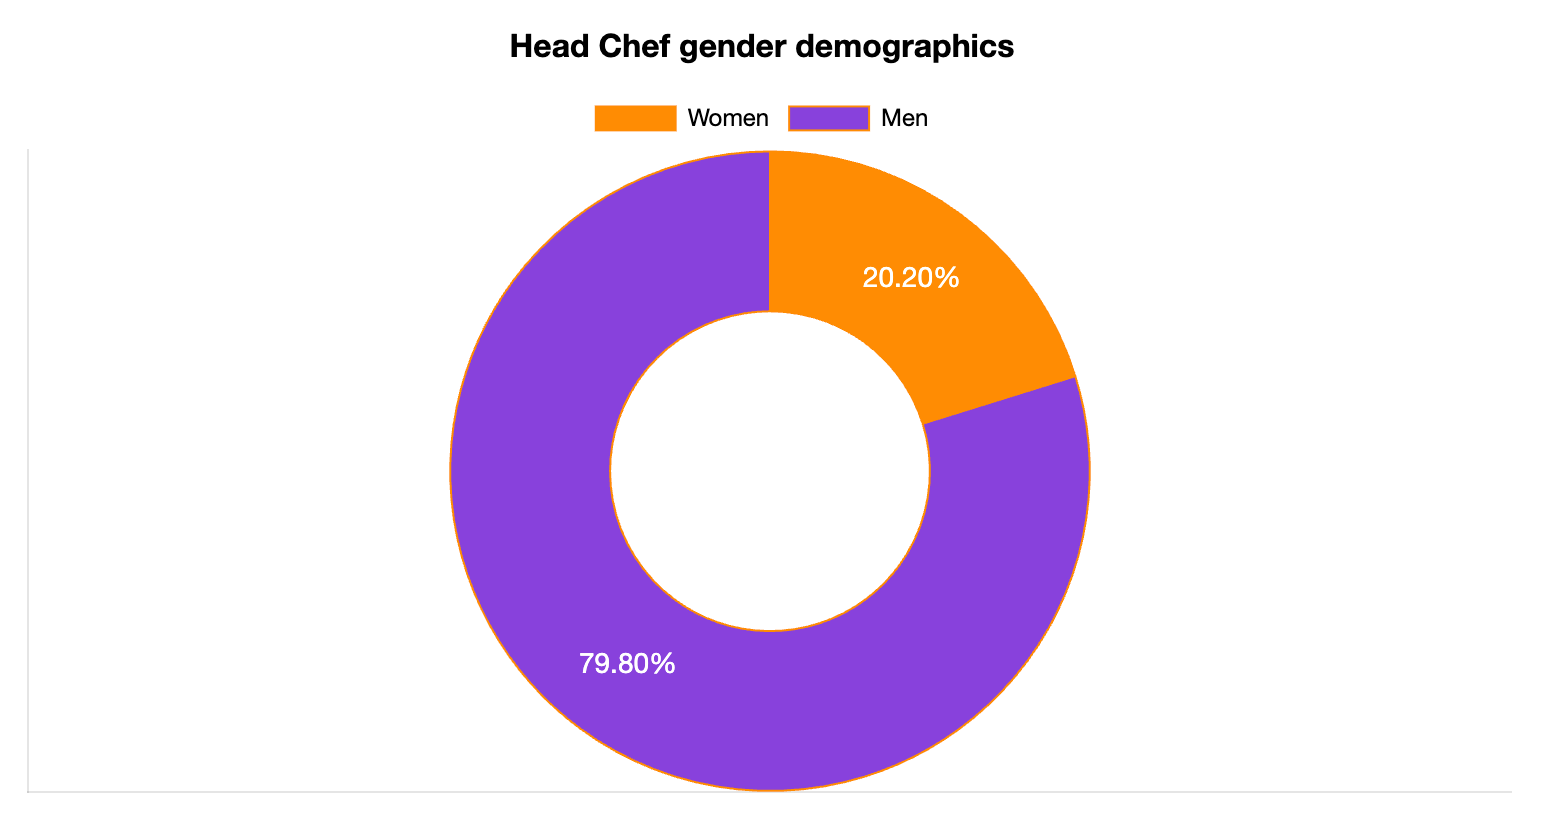
- 79.8% of all Head Chefs are men
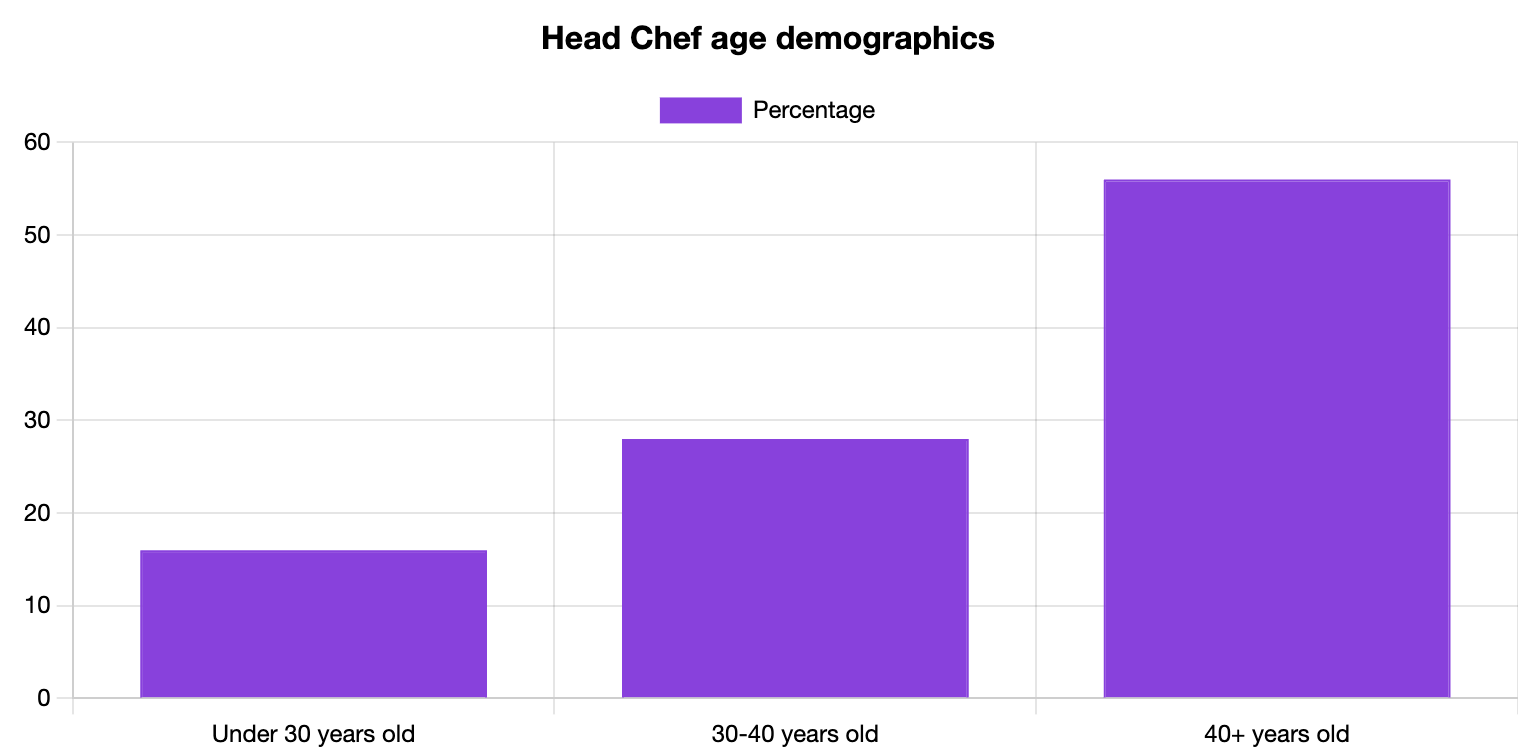
- Only 16% of all Head Chefs are younger than 30
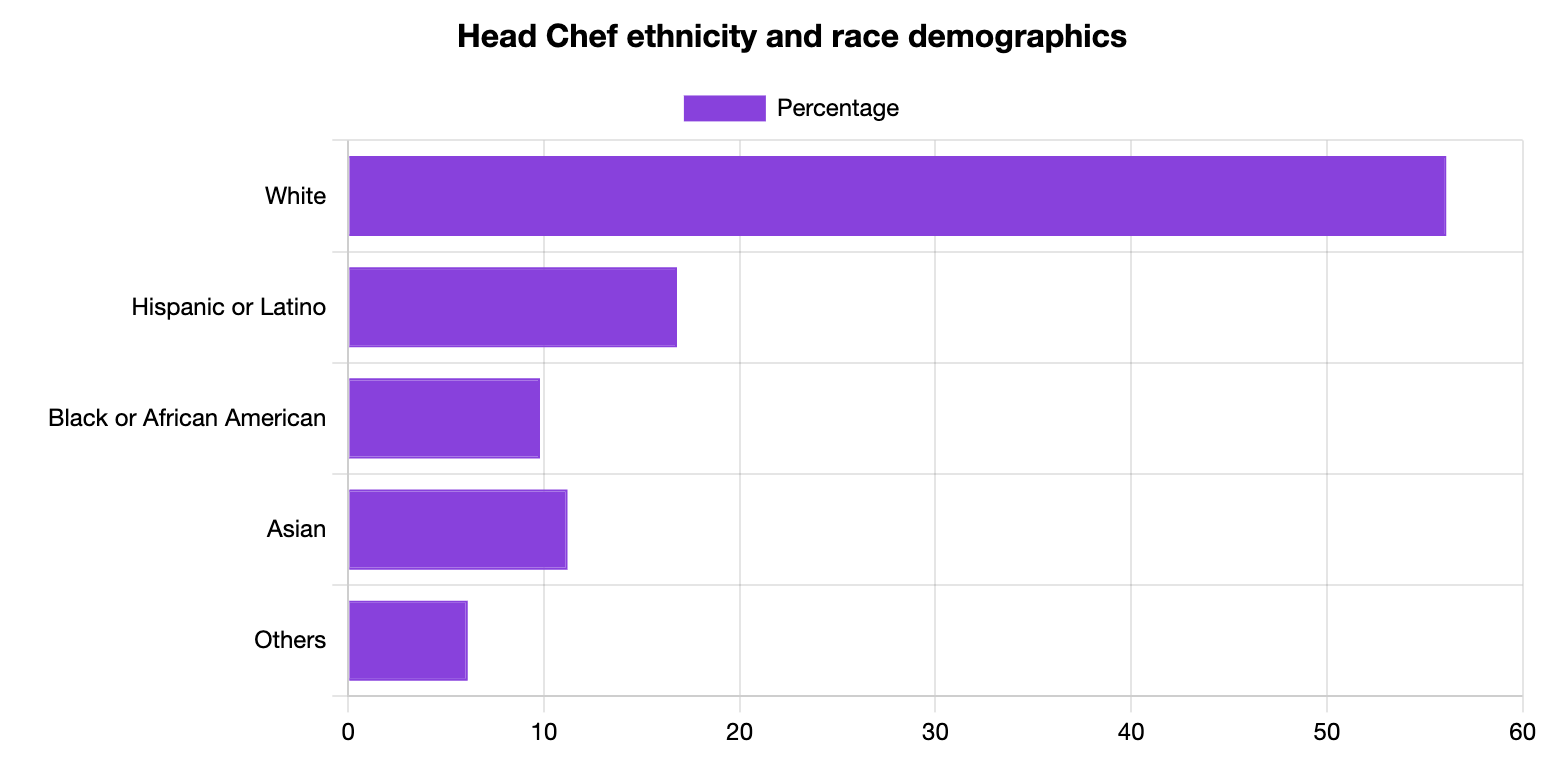
- 16.8% of all Head Chefs are Hispanic or Latino
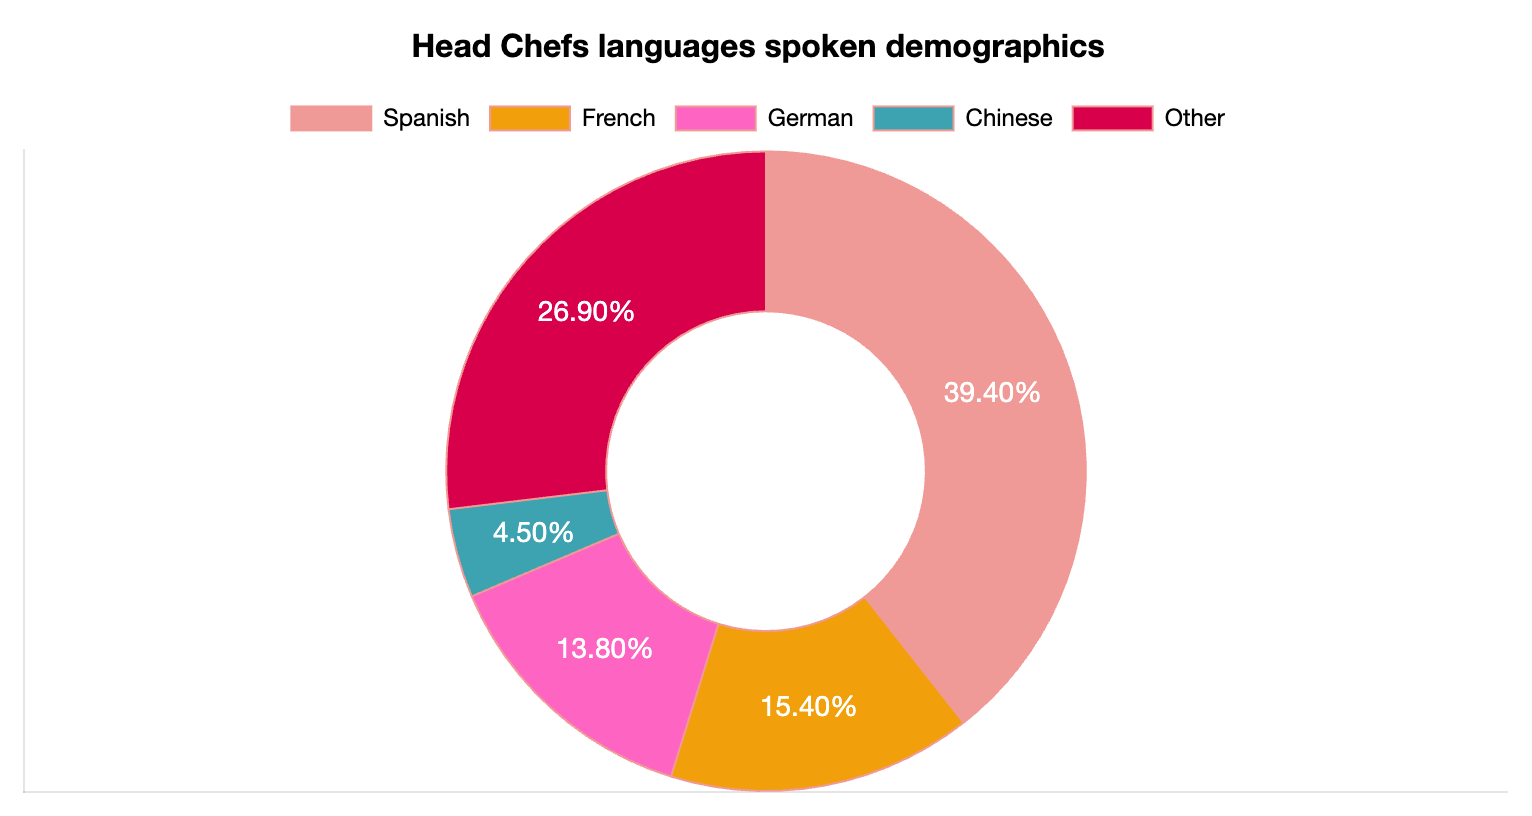
- 39.4% of all Head Chefs who speak a second language speak Spanish
- The average base salary for a Head Chef in the United States is $73,632 per year
Head Chef Employment Statistics
There are currently close to 114,000 Head Chefs working in the United States. This is less than the number of Executive Chefs, as you can see on our Executive Chef demographics.

Head Chef Gender Statistics
Most of the Head Chefs working in the U.S. are men. This is different from the similar Pastry Chef role, where women comprise the majority.
See more on our Pastry Chef demographics page.
Head Chef Age Statistics
Most Head Chefs are older than 40 years (56%), followed by 28% of Head Chefs who are between 30 and 40 years of age.
See the full breakdown of Head Chef age below.
Head Chef Ethnicity and Race Statistics
Of all the Head Chefs in the United States, 56.1% are white, while 11.2% are Asian. While Caucasians dominate most of the hospitality roles, there are slightly higher numbers of Asian Sushi Chefs in U.S. than in other roles, as you can see on our Sushi Chef demographics.
See statistics about race and ethnicity for Head Chefs in the graph below.
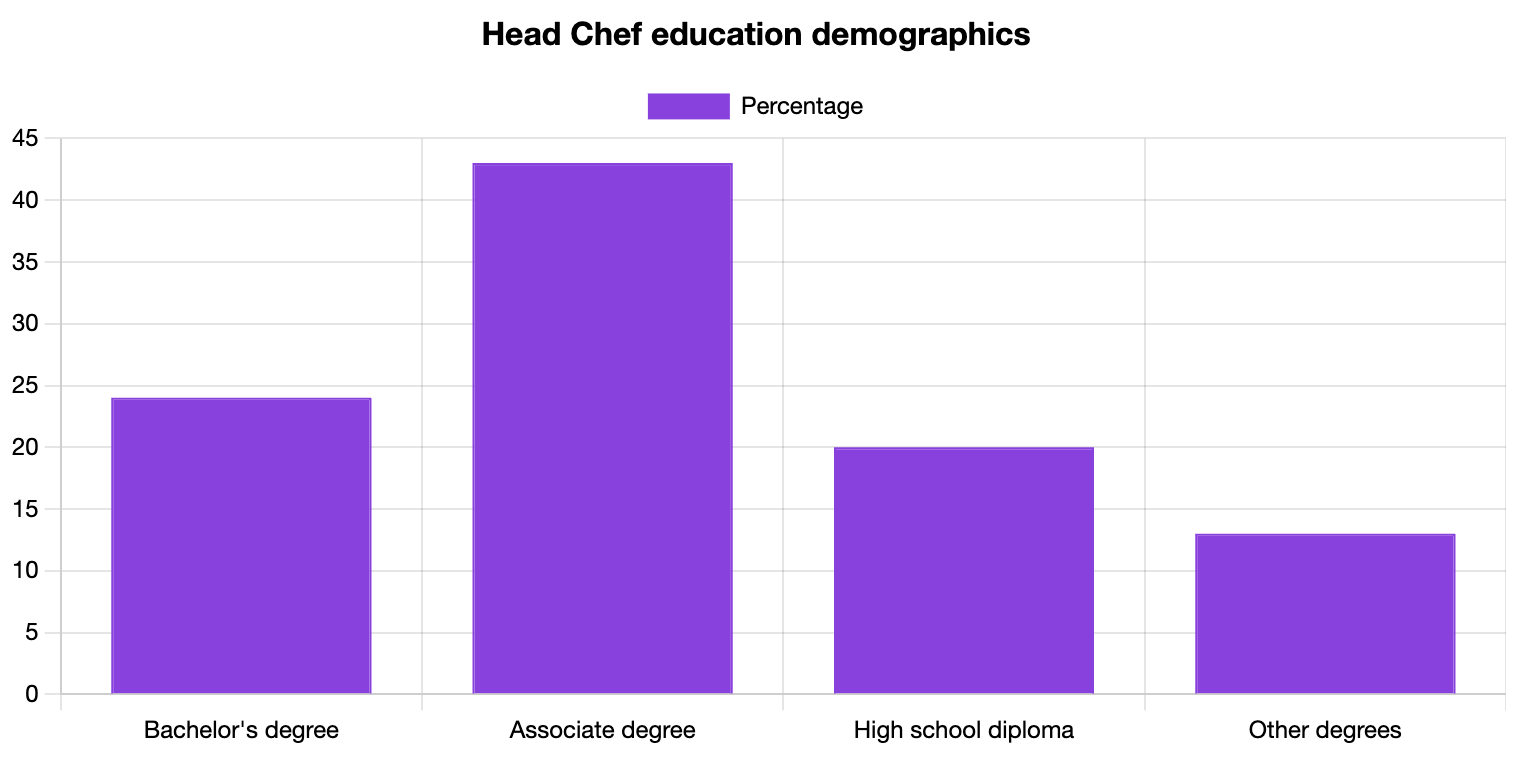
Head Chef Education Statistics
Most Head Chefs (43%) have an associate’s degree, while a smaller number of people working in the Head Chef role have a bachelor’s degree.
While it is possible to work as a Head Chef without formal education, having it won’t hurt your odds against the competition.
Explore the graph below to see Head Chef educational attainment in the United States.
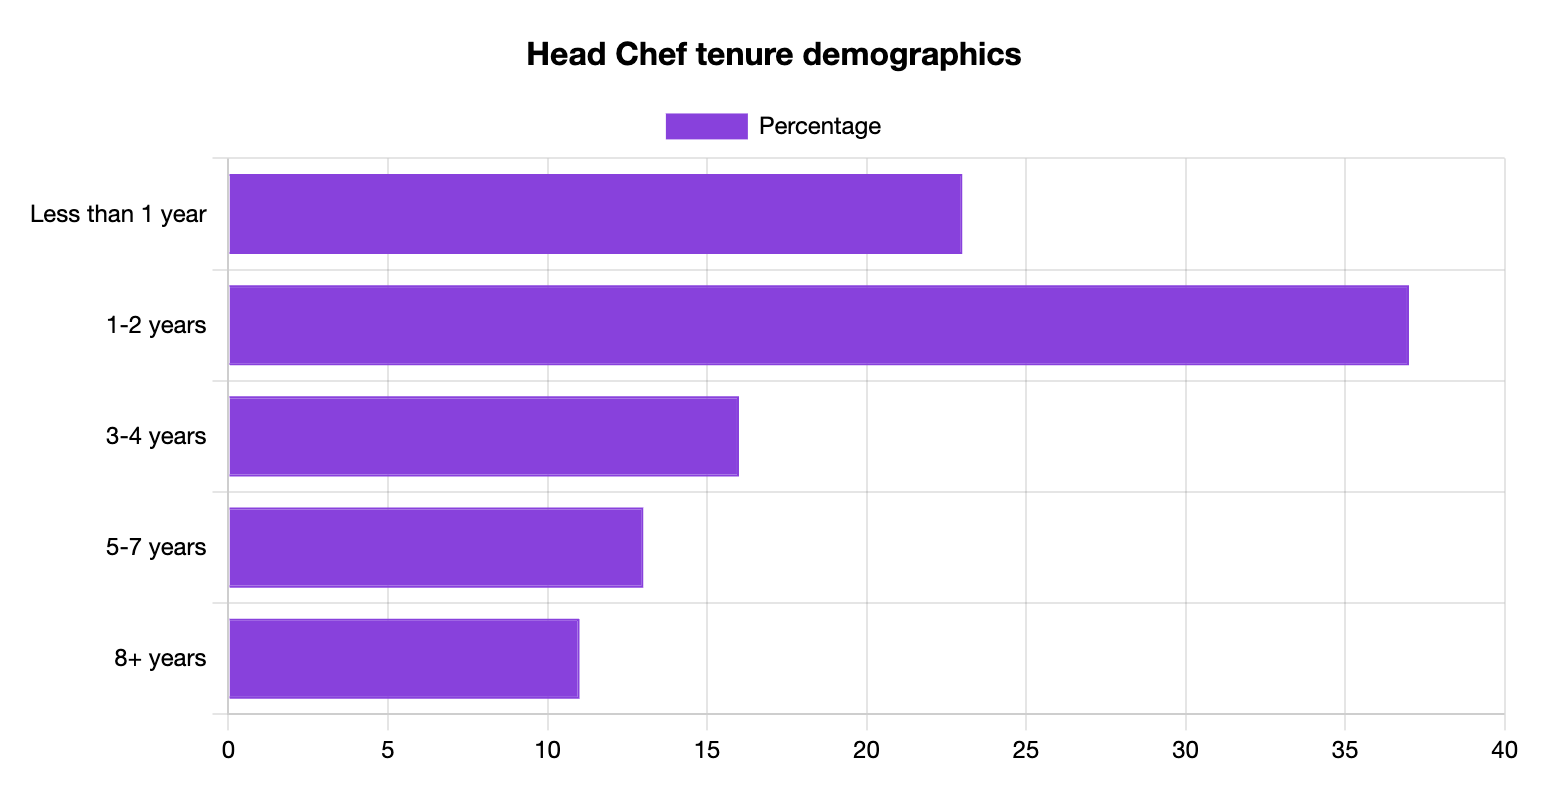
Head Chef Tenure Statistics
On average, a Head Chef will stay in the same position for up to two years (37%). That said, the hospitality sector has a high turnover rate, and Head Chefs are no exception to the rule.
In fact, 23% of all Head Chefs leave a job after less than a single year.
See Head Chef tenure statistics below.
Head Chef Industry Statistics
According to the Bureau of Labor Statistics, Chefs and Head Cooks work across several different industries, and Head Chefs are a part of this group.
While restaurants and other eating places employ the most Head Chefs, they also work in special food services and traveler accommodation.
See the breakdown of where Head Chefs work in the table below.
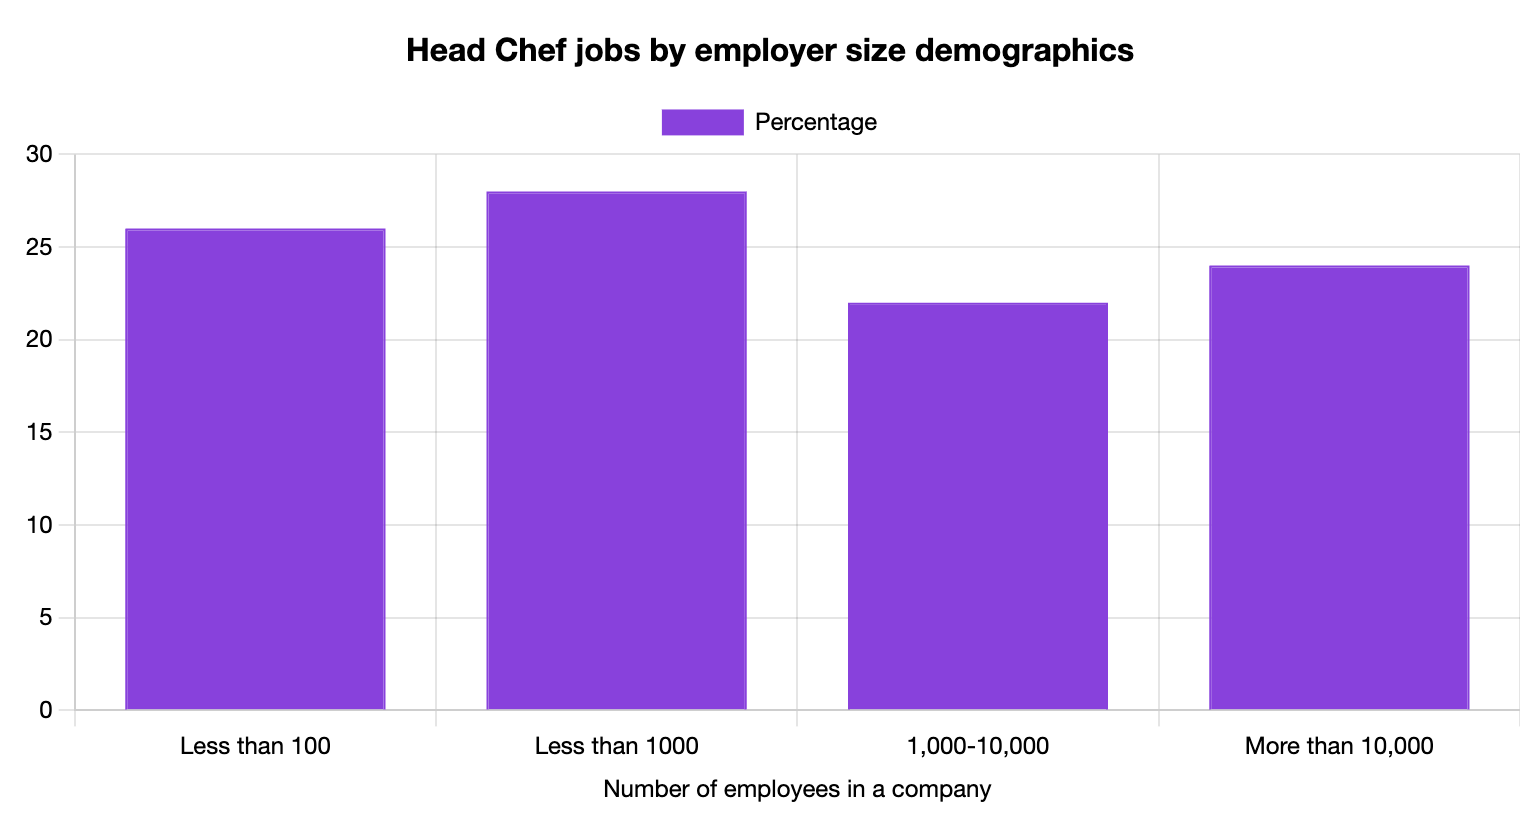
Head Chef Jobs by Company Size
Head Chefs also work for employers of different sizes.
While most Head Chefs work in establishments with less than a thousand employees (28%), a smaller number of them (22%) work for companies that have 1,000-10,000 employees.
See the full breakdown of Head Chefs by employer size below.
Head Chefs Languages Spoken
Alongside English, a lot of Head Chefs also know Spanish, followed by French (15.4%) and Italian (13.8%).
See what other languages Head Chefs speak below:
3 More Head Chef Stats
- 24% of Head Chefs have a bachelor’s degree
- Most Head Chefs (37%) stay in the same role for less than two years
- Most Head Chefs (51%) work in restaurants and similar eating places
Head Chef Statistics and Demographics Data
We collect our data from multiple sources.
To see how we found the statistics for Head Chefs, explore our statistics and demographics methodology page.

Written by Vukasin Petrovic
Vukasin is an experienced content creator with more than five years of writing and editing experience. With a background in English and an MFA in Creative Writing, he excels in digital marketing and copywriting, crafting narratives that engage the audience.

Reviewed by Stefan Petrov
With over 10 years of experience as a writer and editor, Stefan has worked in the automotive, IT, health and hospitality industries. Familiar with Google Search Console and other SEO tools like Ahrefs and Semrush, Stefan uses his experience to create content that's visually appealing to the user but also ranks in the SERPs.