20 Insightful Statistics About Event Planners – 2026
In this article, we’ve prepared some of the most informative and interesting statistics about Event Planners that you’ve probably never run across before.
- Since 2019, the unemployment rate has been rising and is currently set at 12%
- 20% of Event Planners work in the education sector, followed by Fortune 500 companies (11%)
- 51% of the workforce is hired in the private sector, while only 2% work for the government
- It is estimated that Event Planners with master’s degrees make only $50 more yearly than those with bachelor's degrees
- Event Planners have had a 14% increase in pay since 2019 and are currently earning $62,280 on average
Event Planner Employment Statistics
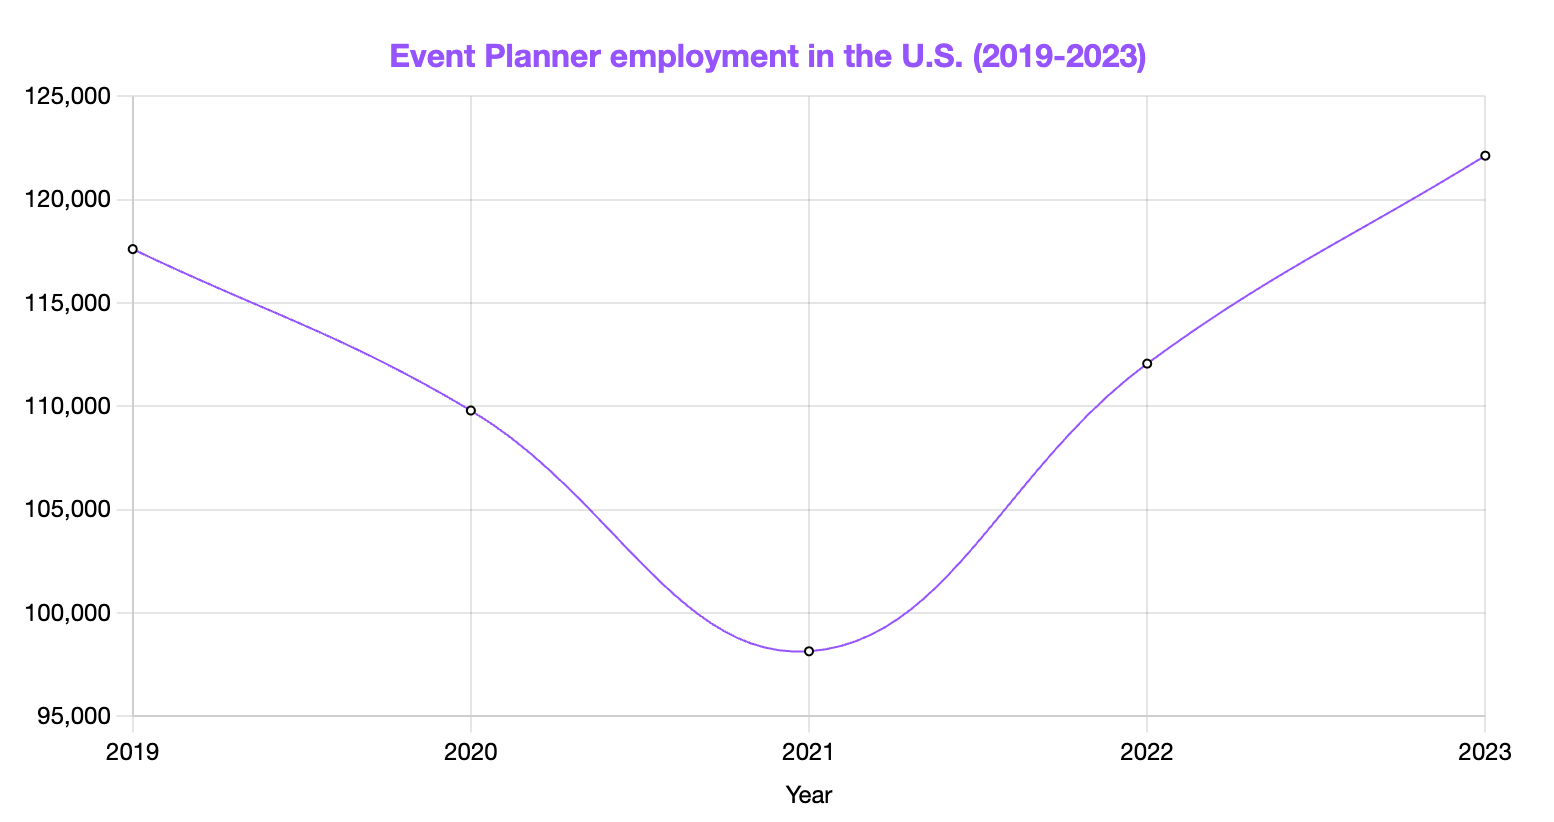
The event planning industry has continued to grow steadily ever since the 2020 pandemic. It is estimated that it will increase by 7% from 2023 to 2033.
Currently, there are significantly more Event Planners than Event Managers, as you can see on our Event Manager demographics page.
Event Planner Gender Statistics
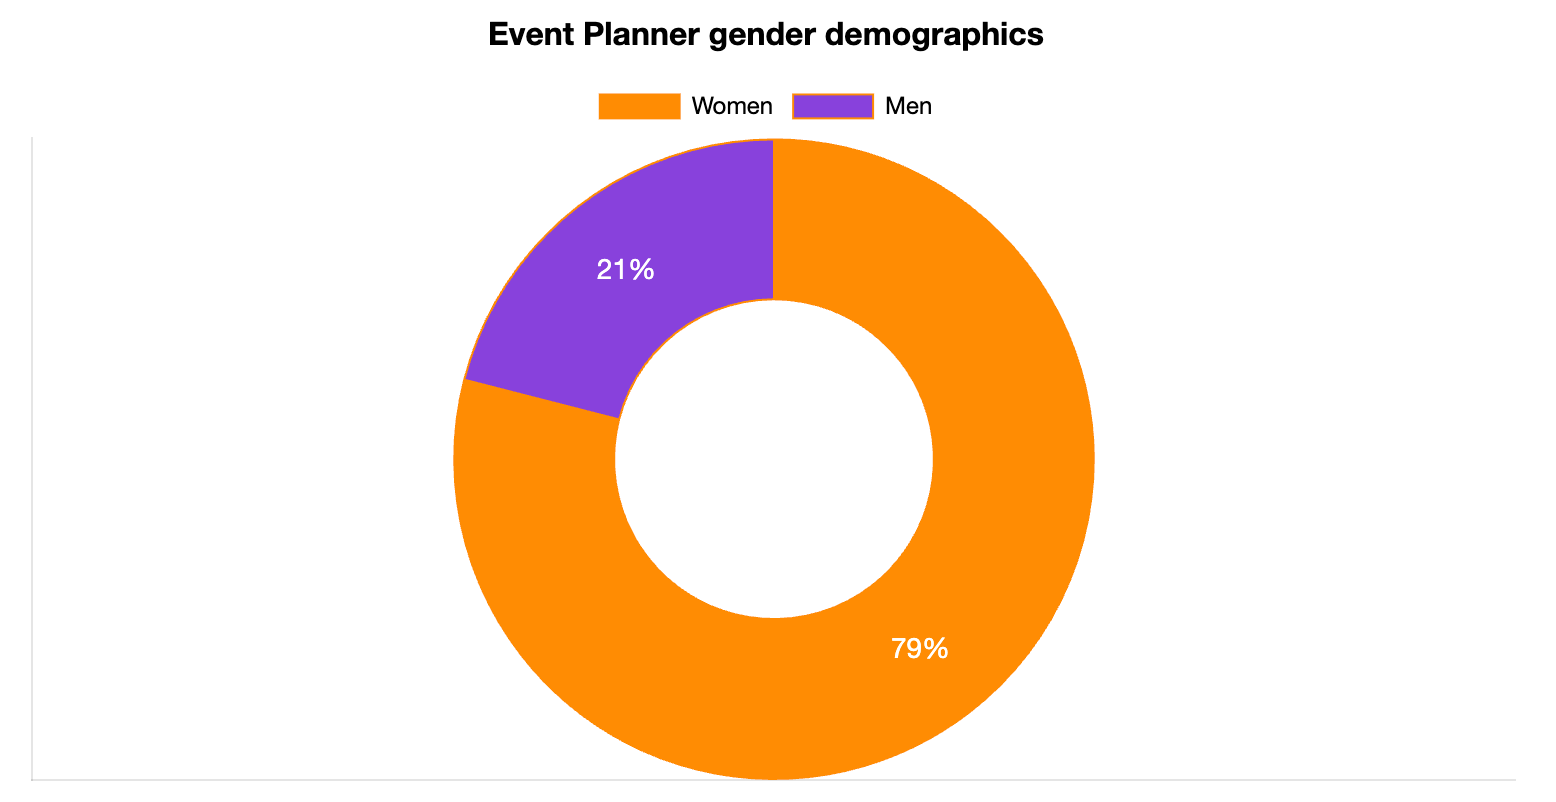
Event planning is a female-dominated industry, with 79% of the workforce being women and only 21% men.
This aligns with similar occupations: as you can see on our Event Coordinator page, it is another female-dominated role.
Event Planner Age Statistics
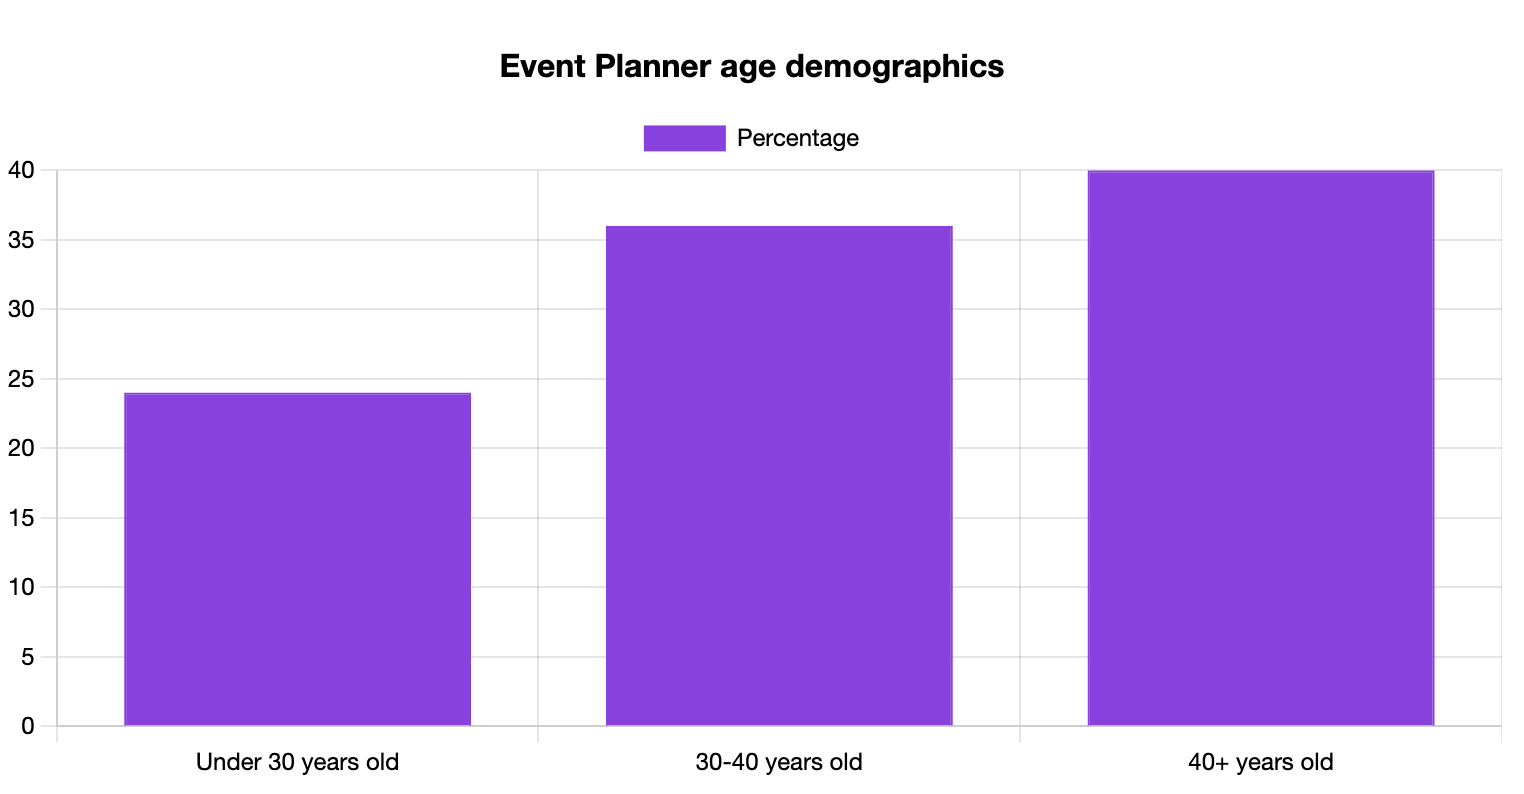
76% of Event Planners are older than 30 years. This is opposite from the Host/Hostess role where most individuals are younger than 30 as you can see on our Hostess demographics page.
Event Planner Employment Type Statistics
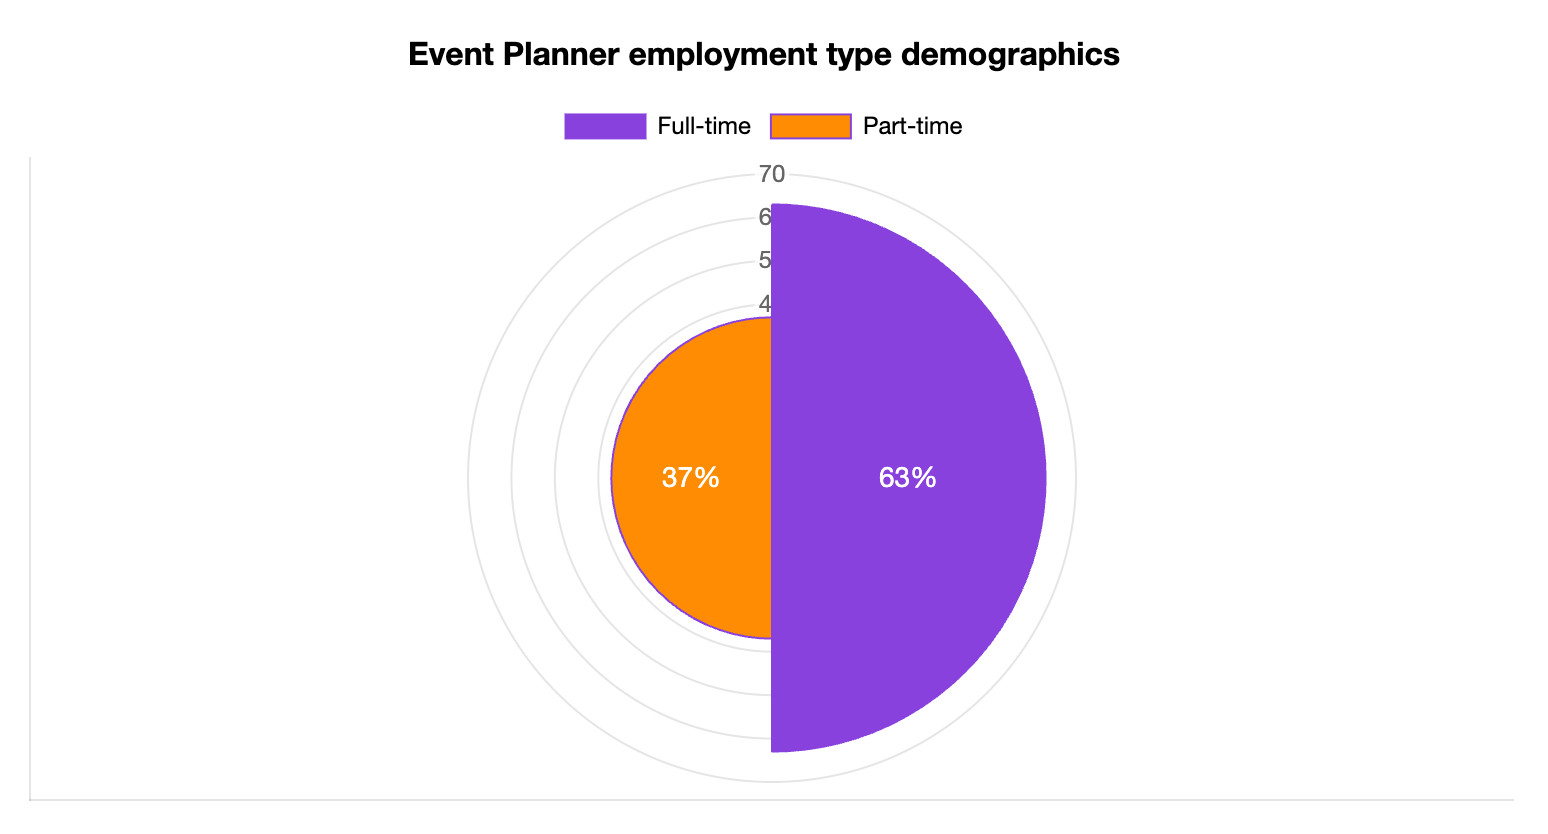
Most Event Planners work full-time (63%), while less than half work part-time (37%).
Event Planner Ethnicity and Race Statistics
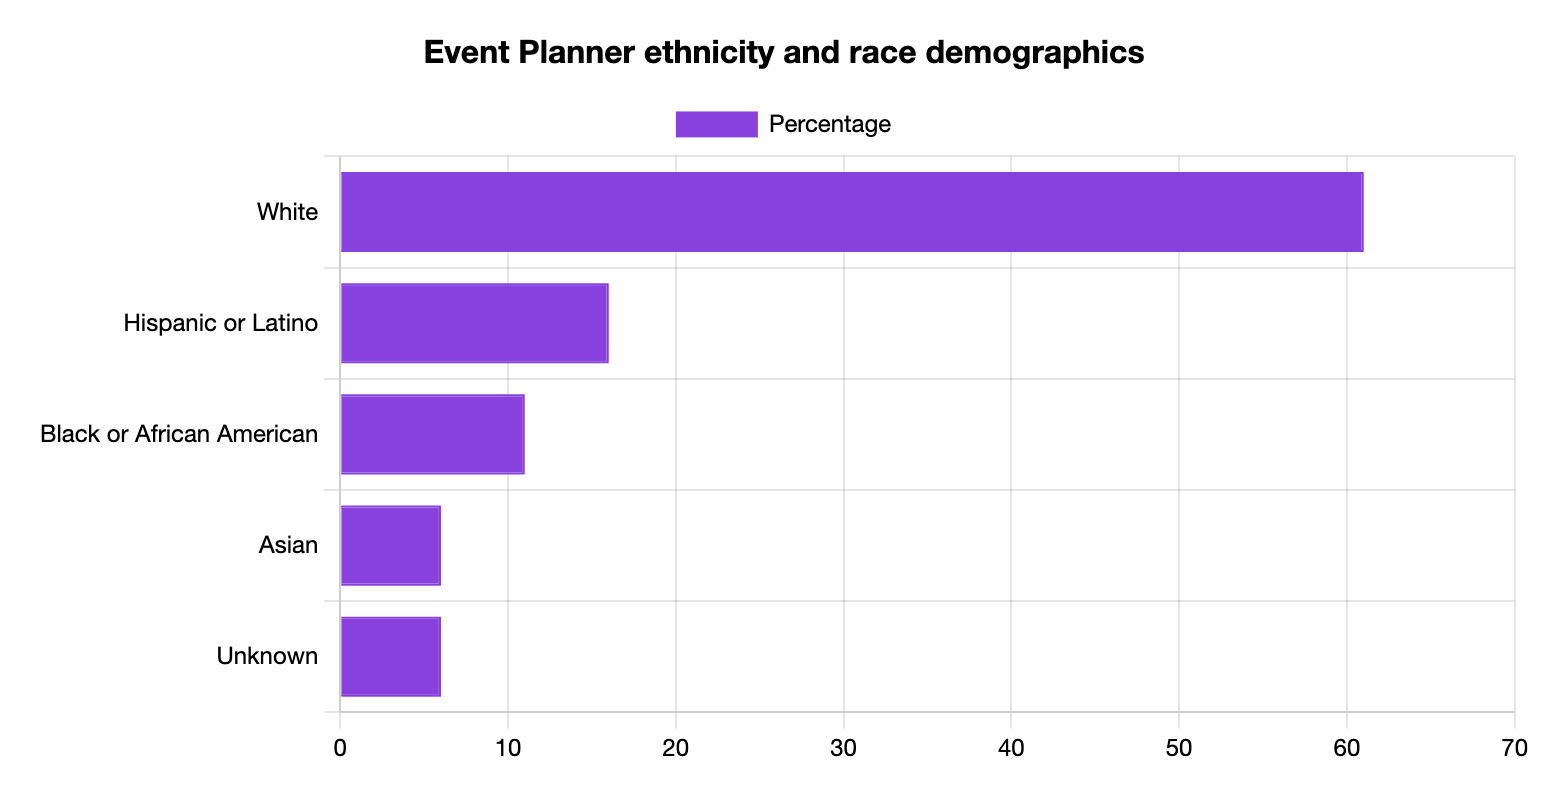
61% of Event Planners are white, followed by Hispanic (16%) and African American minorities (11%).
The Concierge role has a similar breakdown according to race and ethnicity and you can learn more on out Concierge demographics page.
Event Planner Education Statistics
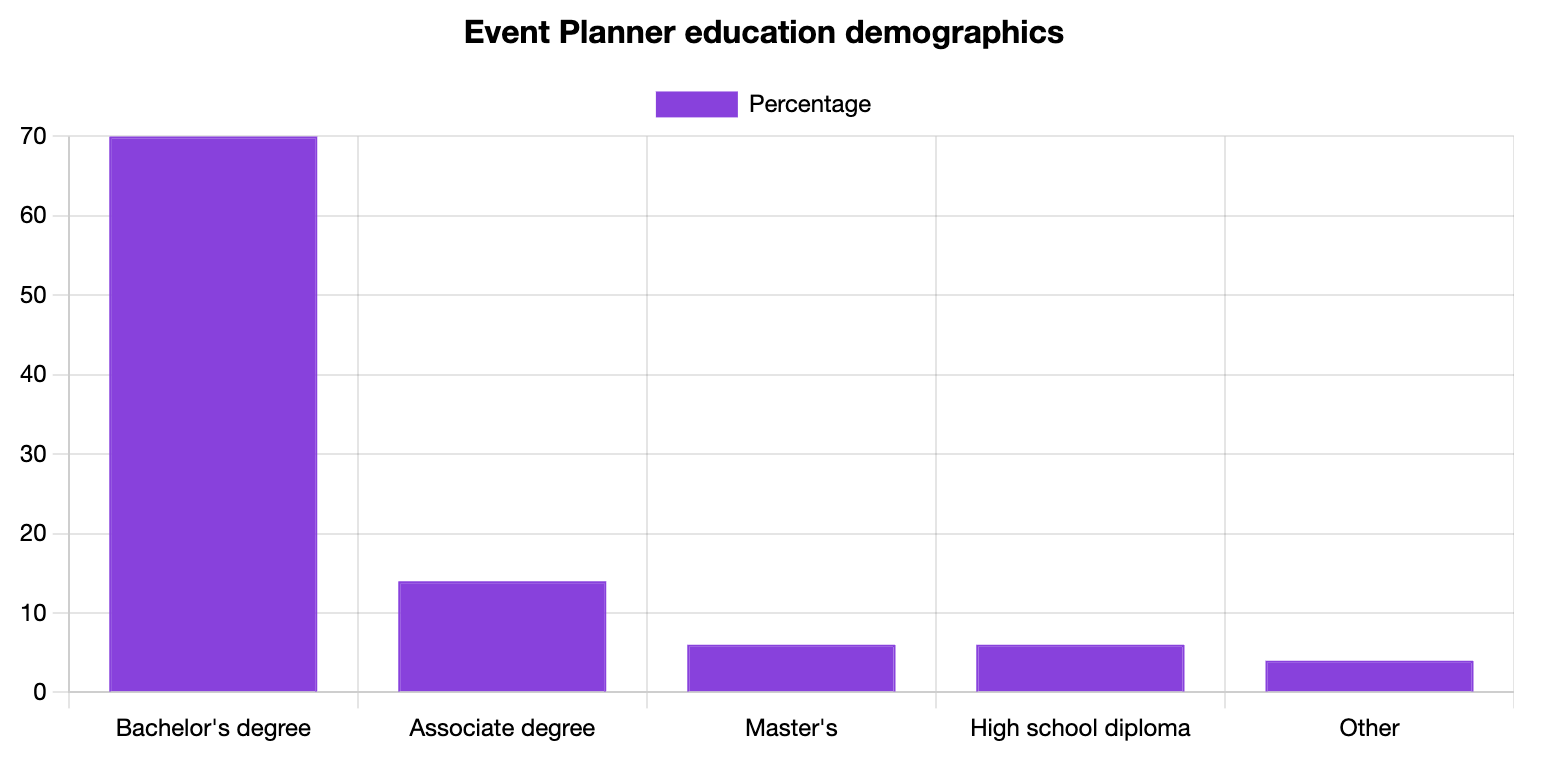
Given the skills needed to organize an event from start to finish, the majority of Event Planners end up going to university and obtaining a bachelor's degree (70%).
Event Planner Tenure Statistics
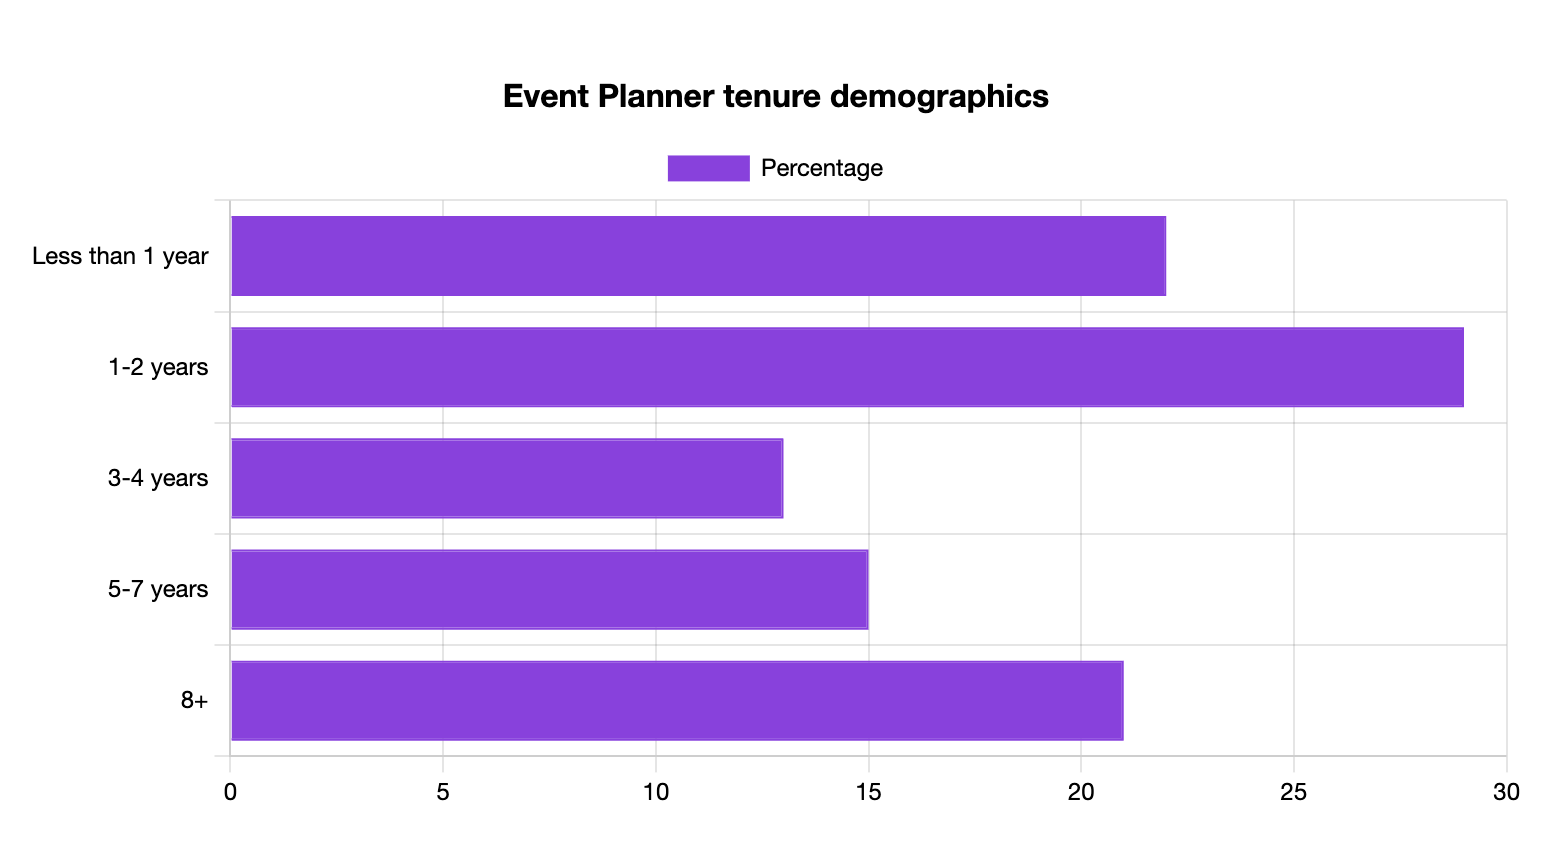
Typically, Event Planners stay in this role for one to two years (29%). However, it is estimated that 21% of the workforce maintains this position for more than eight years.
Event Planner Jobs by Industry
Event Planner Jobs by Company Size Statistics
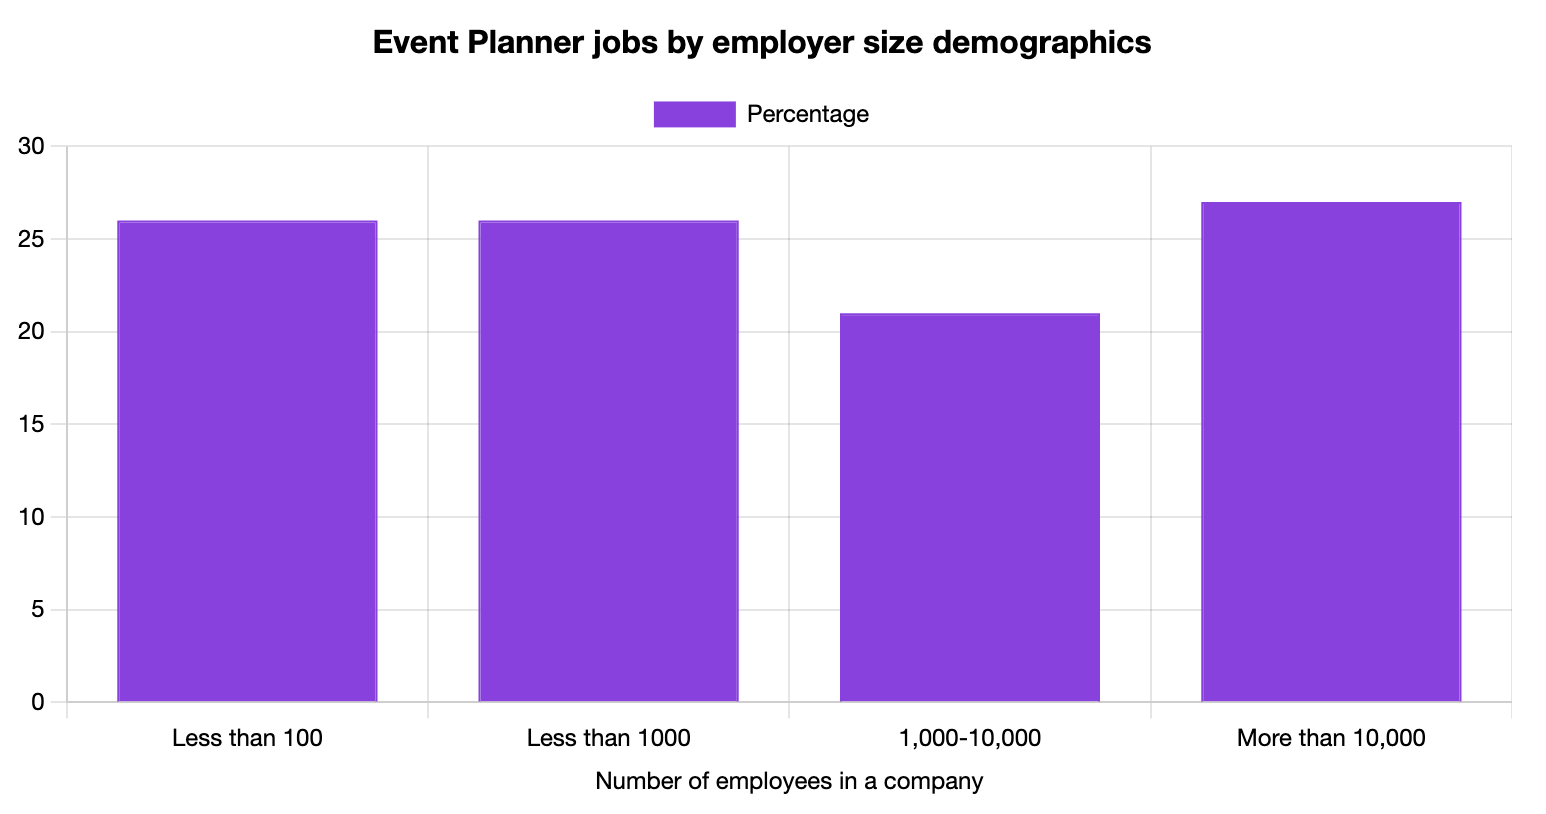
Event Specialists are present in companies of all sizes.
Event Planner Languages Spoken
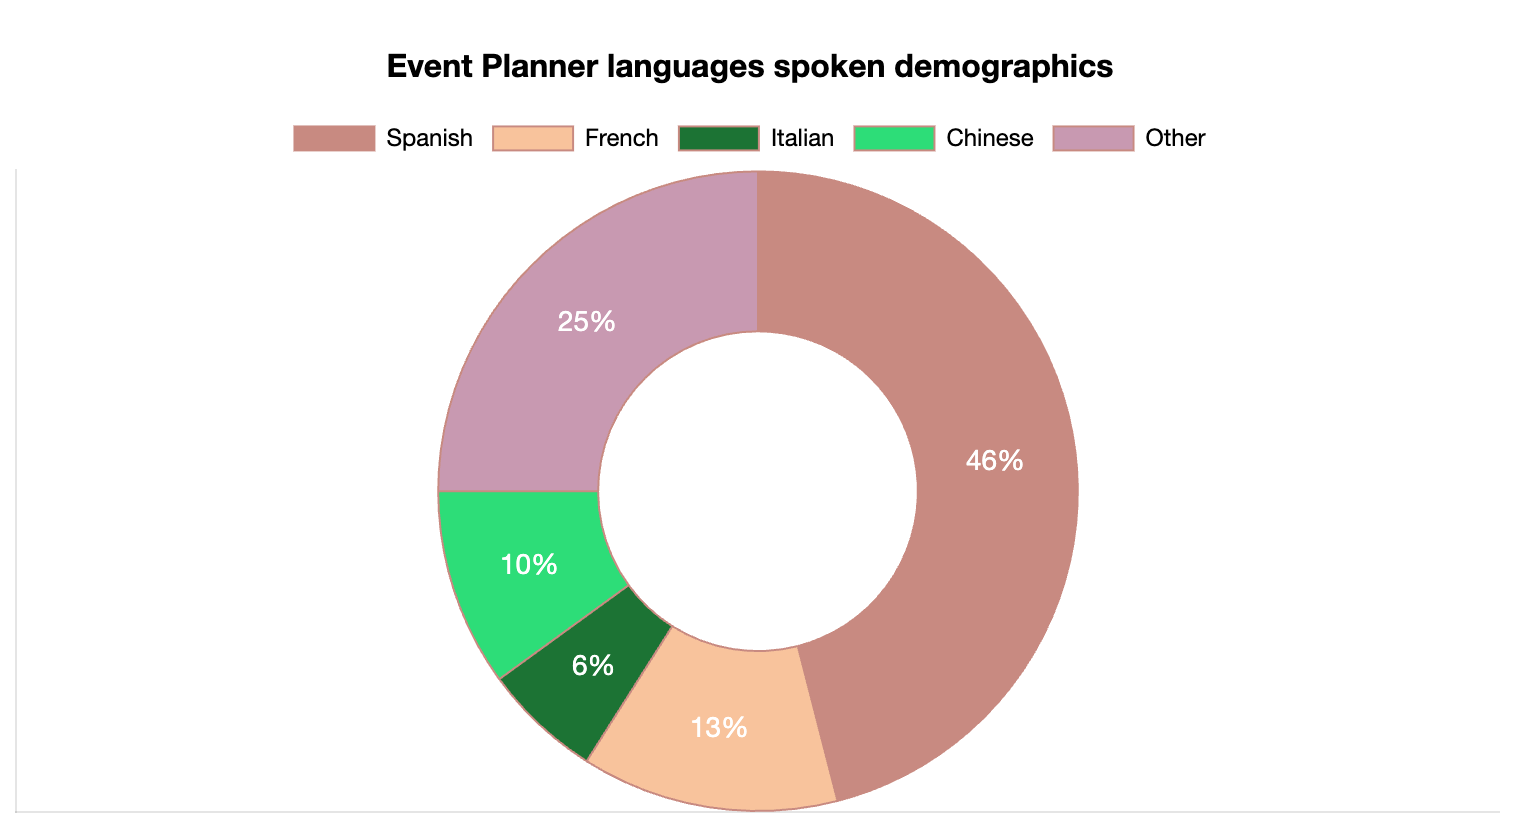
Spanish (46%), French (13%) and Chinese (10%) are the leading additional languages spoken besides English among Event Planners in the U.S.
5 More Event Planner Stats
- Event Planners of Latin origin earn the least in the industry compared to other ethnicities ($48,906)
- It is expected that the event industry market will grow to $2 trillion by 2028
- 34% of Event Specialist hold a bachelor’s degree in Business and Communication
- 11% of the professionals in the field have graduated from the University of Phoenix
- The top four states with the highest demand for Event Planners are: New York, California, Florida and Texas
Event Planner Statistics and Demographics Data
We’ve developed a special analysis method that we use to present the data in the most accurate and relevant manner. To read more about how we extract information, check out our demographics and statistics page.

