Barback Demographics and Statistics in the US – 2026
If you’re looking to start your Barback career or just want to learn the demographics and statistics related to this role, you came to the right place.
In this article we’ll explore Barback salaries, their educational attainment and more.
- The average Barback salary in the United States is $31,688 per year without tips
- Barbacks working in Miami earn $28,506 per year
- $31,976 per year is the average salary for a Barback working in NYC
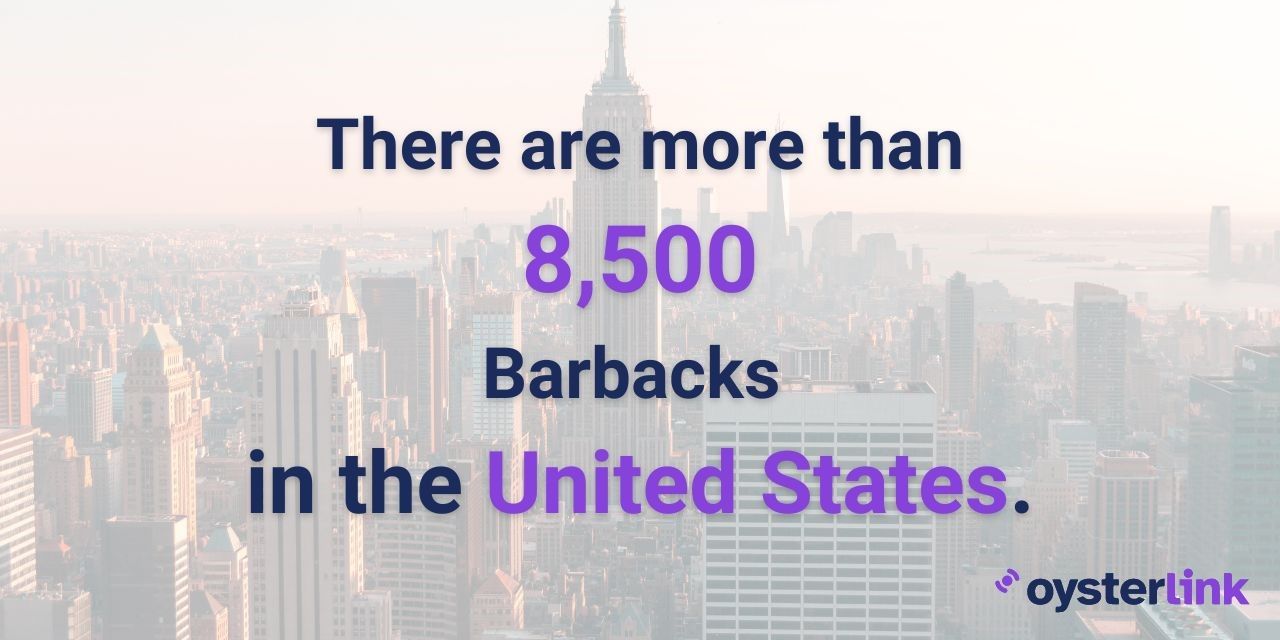
- There are roughly 8,500 people currently work as a Barback in the U.S.
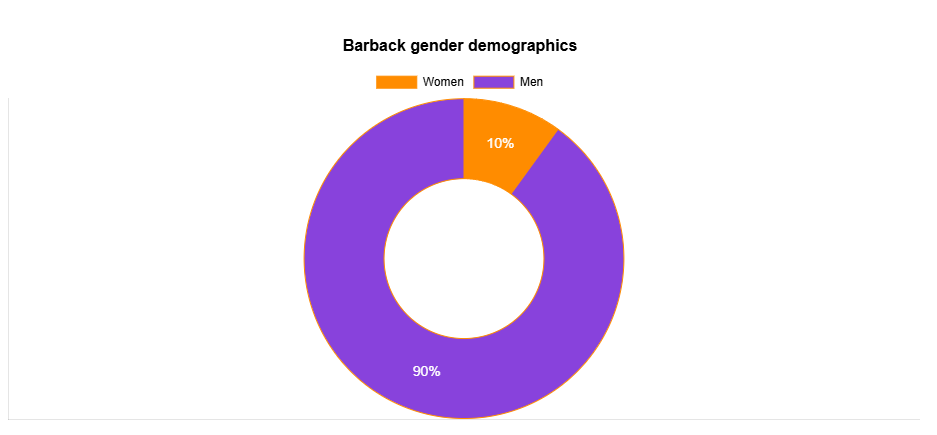
- 90% of all Barbacks are men
Barback Employment Statistics
There are more than 8,500 Barbacks working in the United States.
Barback Gender Statistics
Only 10% of all Barbacks are women, meaning most employees in this role are men. This is different from the Bartender role where most Bartenders are women, as per our Bartender demographics page.
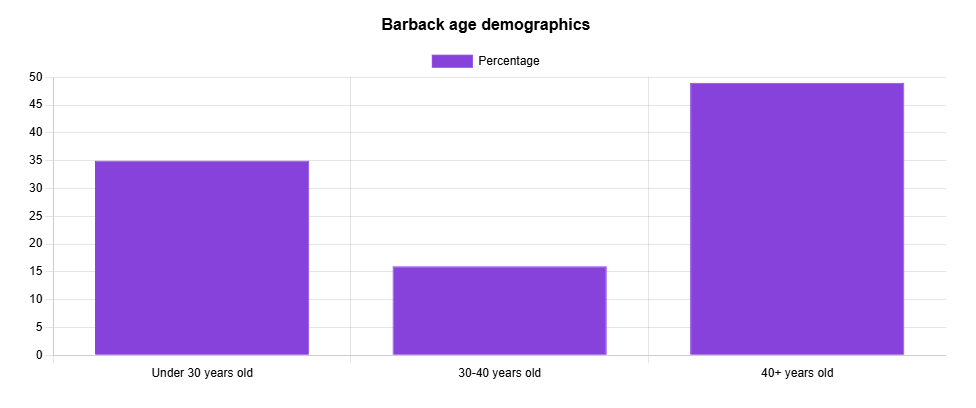
Barback Age Statistics
Most Barbacks are older than 40, while 35% of individuals working as a Barback in the United States are younger than 30.
This is different from the Waitress demographics in the U.S. where most of individuals working in that role are between 20 and 30 years old.
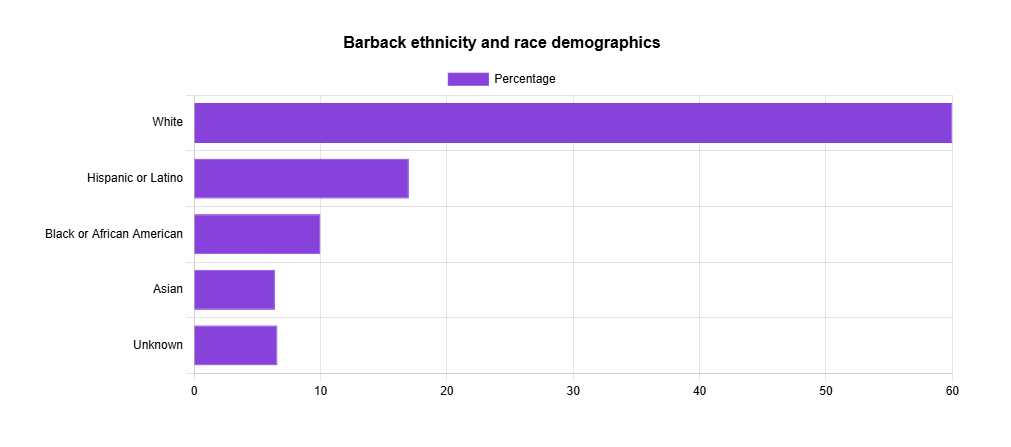
Barback Ethnicity and Race Statistics
Most Barbacks are white, followed by Hispanic or Latino individuals (17%) and Black or African Americans (10%).
This breakdown is similar to other hospitality roles, such as the demographics of Servers.
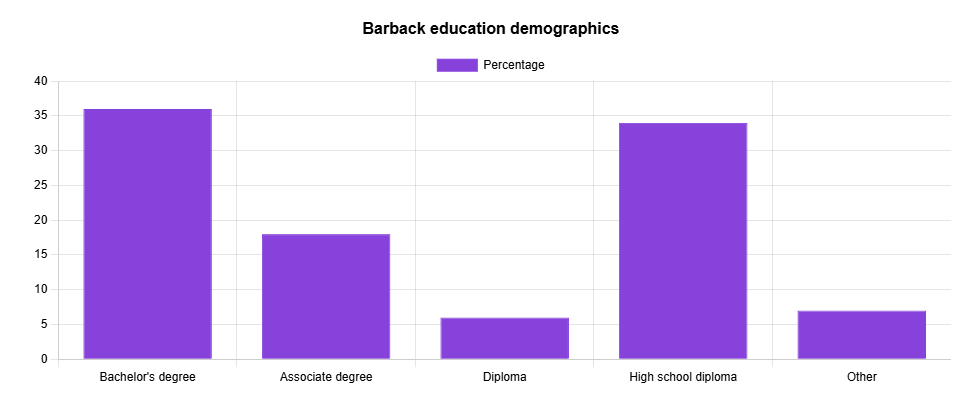
Barback Education Statistics
Landing a Barback job in the United States does not require extensive education or experience.
That said, 36% of all Barbacks have a bachelor’s degree while 34% of them have a high school diploma.
Explore Barback education in the graph below.
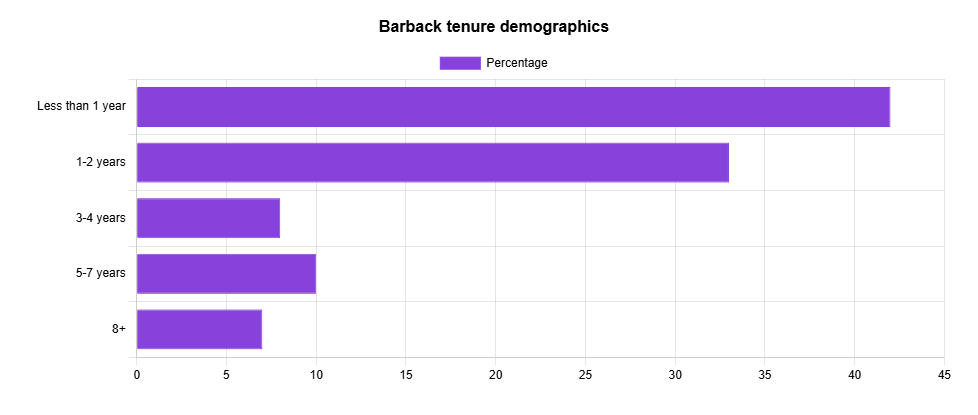
Barback Tenure Statistics
Most Barbacks stay with the same employer for less than one year, followed by 33% of Barbacks who stay at the same job for up to two years.
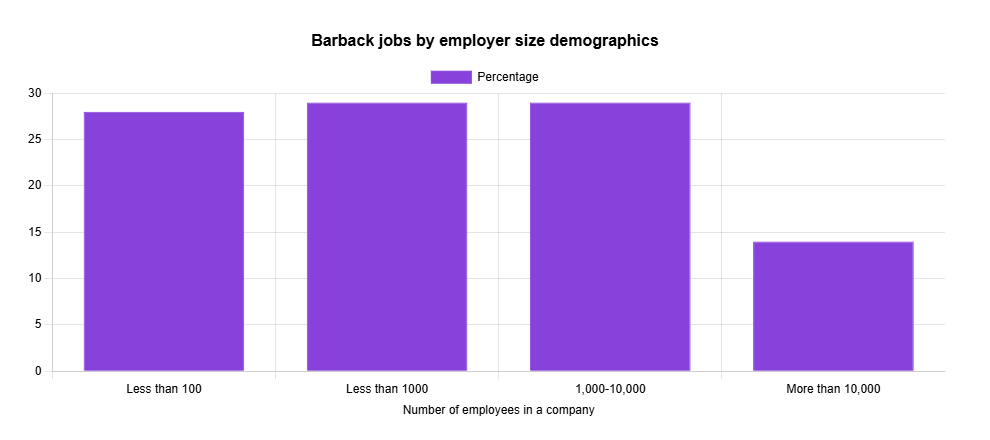
Barback Jobs by Company Size
Barbacks work in restaurants, hotels, resorts and similar establishments. As such, the size of their employers can significantly vary.
Most Barbacks work for companies that employ between one and 10,000 people. See the breakdown of Barback employment by the size of their employer.
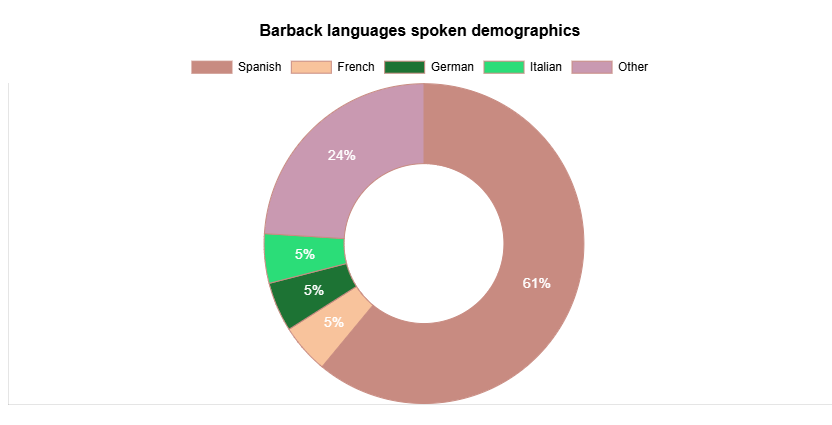
Barback Languages Spoken
Aside from English, many Barbacks can also speak a number of other languages.
While most Barbacks (61%) speak Spanish as their second language, they also speak Russian, German and French.
See the percentage of Barbacks speaking languages other than English below.
6 Additional Barback Statistics
- 49% of all Barbacks are older than 40
- 60% of all Barbacks are white
- Most Barbacks (36%) have a bachelor’s degree
- 42% of all Barbacks stay at the same job for less than a single year
- 29% of Barbacks work in companies that employ between 1,000 and 10,000 people
- California is the highest-paying state for Barbacks ($33,198)
Barback Statistics and Demographics Data
We use multiple government and agency websites, along with our own data to support our statistics and demographics.
See how we do it on our statistics and demographics methodology page.

Written by Vukasin Petrovic
Vukasin is an experienced content creator with more than five years of writing and editing experience. With a background in English and an MFA in Creative Writing, he excels in digital marketing and copywriting, crafting narratives that engage the audience.

Reviewed by Stefan Petrov
With over 10 years of experience as a writer and editor, Stefan has worked in the automotive, IT, health and hospitality industries. Familiar with Google Search Console and other SEO tools like Ahrefs and Semrush, Stefan uses his experience to create content that's visually appealing to the user but also ranks in the SERPs.