Waiter/Server Statistics 2025: 3 Key Takeaways
- There are around 2,237,850 waitstaff that work in the United States.
- Waiters/Servers earn an average hourly wage of $17.56 (before tips).
- Tips make up about 69% of a Waiter/Server’s earnings, on average.
We’ve compiled these Waiter/Server statistics for 2025 to highlight key aspects of the profession, including employment trends, demographics, wages and job satisfaction.
Waiter/Server Employment and Job Outlook
The waitstaff profession is a large part of the U.S. workforce, with about 2,237,850 Servers currently employed and 2,277,900 jobs available nationwide.
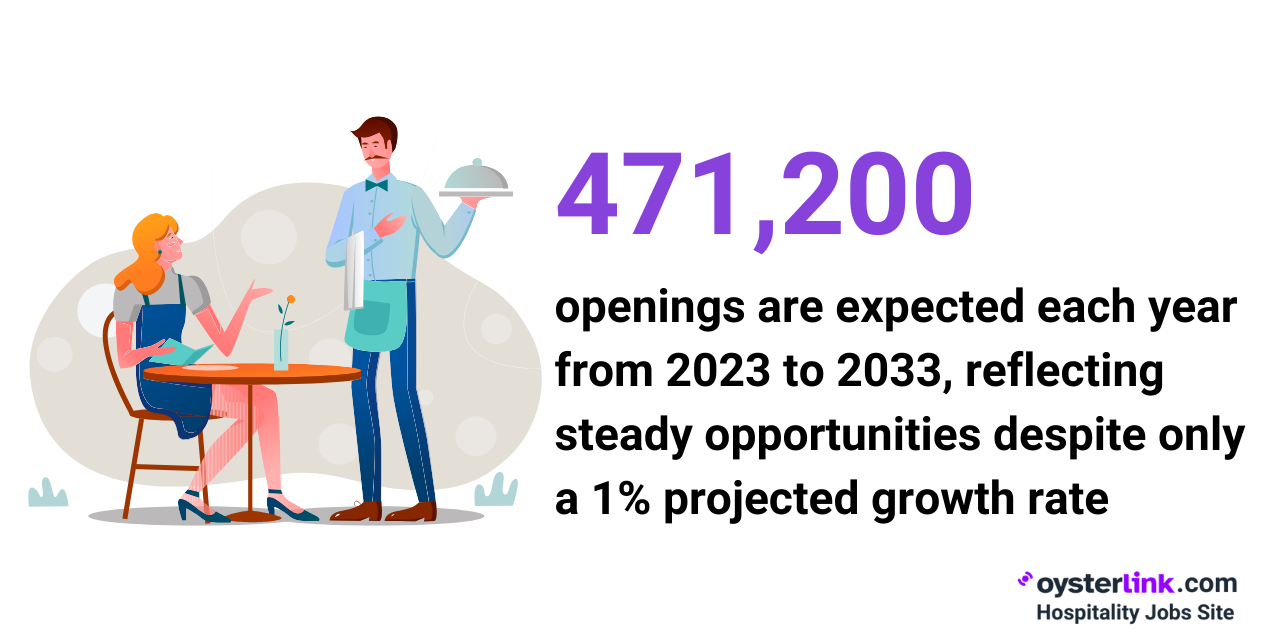
Each year, an average of 471,200 openings are expected between 2023 and 2033, reflecting steady opportunities despite only a 1% projected growth rate.

Waiter/Server Employment by Location
Opportunities for Waiters vary widely throughout the country, with some states and metropolitan areas having significantly higher employment levels.
That said, here are the top five states when it comes to employment levels for waitstaff: California, Texas, Florida, New York and Illinois.
Demographics of Waiters/Servers in the US
Below are demographics that provide insight into the makeup of this workforce, including age, gender and educational background.
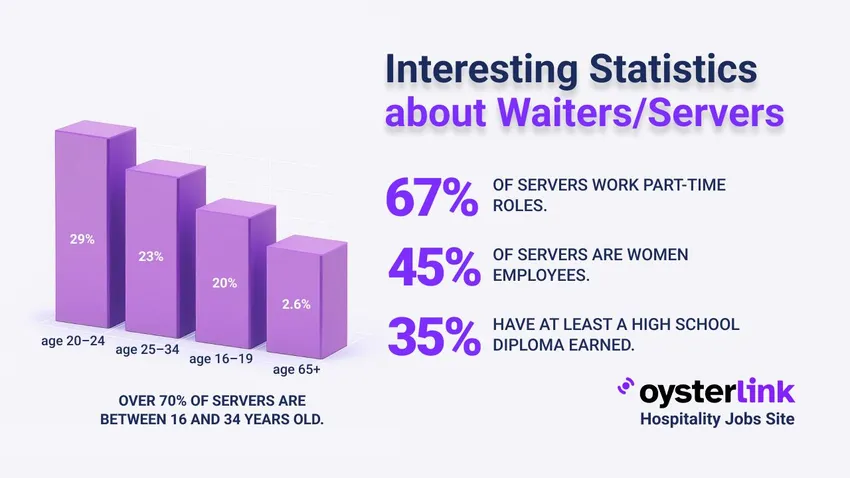
Most Servers in the U.S. work part-time, with 67% holding part-time roles and just 33% working full-time.
The workforce is predominantly female, with about 66% of waitstaff identifying as women compared to 34% men.
Career interest follows a similar pattern, as slightly more women (51%) than men (49%) express interest in pursuing work as a Server, though the difference is minimal.
Age is another defining factor of the profession. The median age of Waiters and Waitresses is 25.9, highlighting the industry’s young workforce.
A large share are between 16 and 34 years old, including 20.16% aged 16–19, 28.95% aged 20–24, and 22.96% aged 25–34.
In contrast, older workers make up a much smaller portion, with only 2.58% over the age of 65.
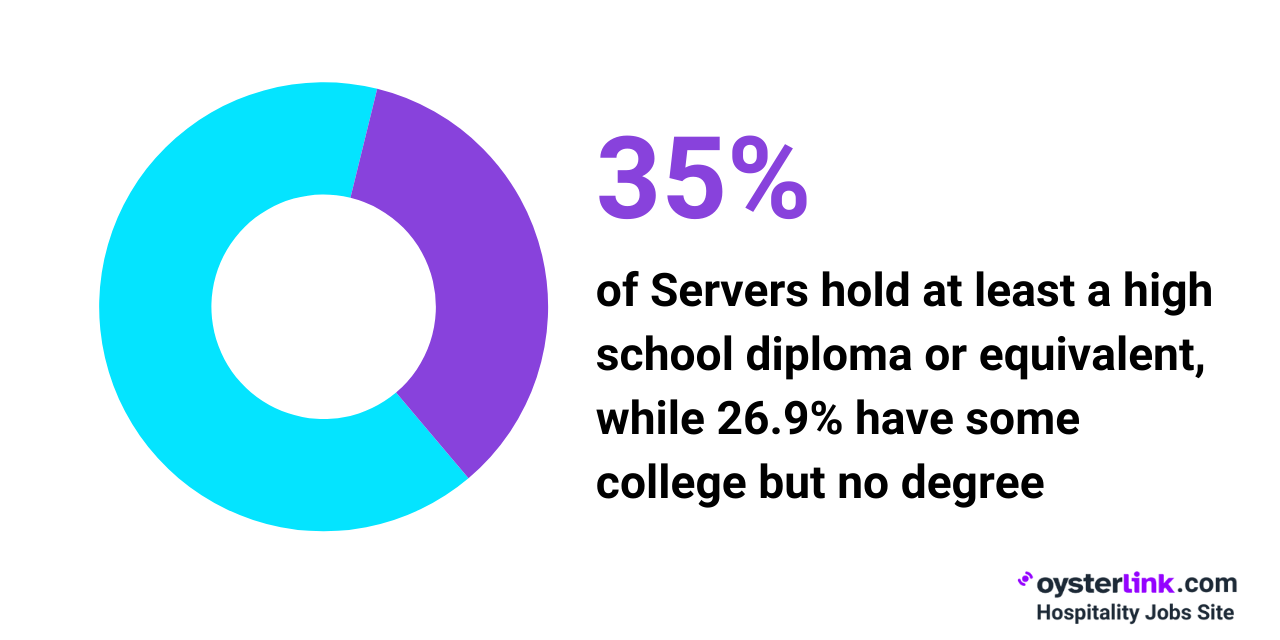
Education levels among Servers vary, though most hold at least a high school diploma or equivalent (35.4%).
Many pursue some college without completing a degree (26.9%), while 22.9% hold either an associate’s or bachelor’s degree.
The most common fields of study include Business, with 44,607 graduates, followed by Visual and Performing Arts (23,420) and Psychology (17,688).

Salary and Overall Income
Compensation for waitstaff depends greatly on location, tipping culture, and type of establishment.
On average, Servers earn a base salary of $36,530 per year, or $17.56 per hour, before tips are included.
Earnings rise significantly at the top end of the profession. The highest-paid 10% of Servers make about $60,090 annually, which translates to $28.89 per hour.
Geography also plays a big role in pay differences. The District of Columbia leads with an average annual base salary of $50,790, followed by New York at $49,796.
Tips remain the most important contributor to income, making up about 69% of a Server’s hourly earnings.
In fine dining restaurants, Servers can earn between $180 and $400 in tips per shift, while those in casual establishments typically make between $100 and $280.
Job Satisfaction and Challenges Among Waiters/Servers
While pay is important, other factors also shape the experience of working as a Server.
Overall career happiness is rated at 2.4 out of 5, while pay satisfaction is slightly higher at 2.6 out of 5.
Personality fit fares better, with most waiters and waitresses giving it an average score of 3.6 out of 5.
Want happier, more motivated Servers? Learn more in our guide on Job Satisfaction for Servers.
Key Trends and Numbers in the Restaurant and Food Service Industry
The restaurant and food service industry continues to shape opportunities for Servers across the U.S.
In 2025, the industry is expected to generate $1.5 trillion in sales, marking a 4% increase from 2024.
There are now over 1 million restaurant and food service outlets operating nationwide, and most remain small businesses.

The industry also offers strong career mobility. Eight in ten restaurant owners began in entry-level roles such as Servers, while nine in ten Restaurant Managers worked their way up from similar positions.
Tipping remains central to Server income. The standard tip range is 15% to 20% of the pre-tax bill, though 20% is increasingly considered the norm for good service.
On average, diners at full-service restaurants tipped 19.8% in 2024, while the overall restaurant average was 18.9%.
These latest statistics on Waiters and Servers highlight a profession that remains integral to the restaurant and food service industry.
With consistent job openings and a relatively young workforce, the role continues to attract individuals seeking flexible schedules and customer-facing experience.
However, wage variability and job satisfaction remain key factors influencing retention in the field.


Loading comments...