We’ve compiled the most relevant hospitality industry statistics of 2025 — such as employment figures, consumer preferences, technological developments and more.
This report will help businesses and job seekers understand where the sector stands and how it's expected to evolve.
US Hospitality Industry Market Size and Growth
The hospitality market in the United States presents a compelling picture of growth and opportunity. But to understand where it’s headed, it’s important to look at the numbers.
Below are some of the most telling stats this year.
- The market size is estimated to reach $247.45 billion in 2025, with projections indicating a further expansion to $313.87 billion by 2030, reflecting a compound annual growth rate (CAGR) of 4.87%. (Source)
- Despite this positive growth trajectory, the U.S. hospitality industry faces ongoing challenges like labor shortages.
- In fact, annual turnover in hospitality is 74%. This is about five times higher than the average 12%–15% range for other industries.
- Tennessee ranks as the best state for hospitality professionals, offering affordable living, strong wages and a projected 25% job growth by 2030.
- In contrast, Hawaii ranks last due to its high cost of living (despite offering high wages), leaving workers to struggle with balancing income and expenses.
- Overall, the global hospitality market reached an all-time high of $4.99 trillion in 2024 and is expected to exceed $6 trillion by 2028. (Source)
Note: Learn more about what’s driving the hospitality industry today by checking out our latest trends report.

The Fastest Growing
Restaurant & Hospitality Job Platform
Looking for top paid jobs? Or Hiring for your business?
US Hospitality Industry Employment and Economic Impact
The hospitality industry is a major source of employment and economic activity in the U.S., supporting millions of jobs across various sectors.
This section highlights its impact on job creation and economic growth.
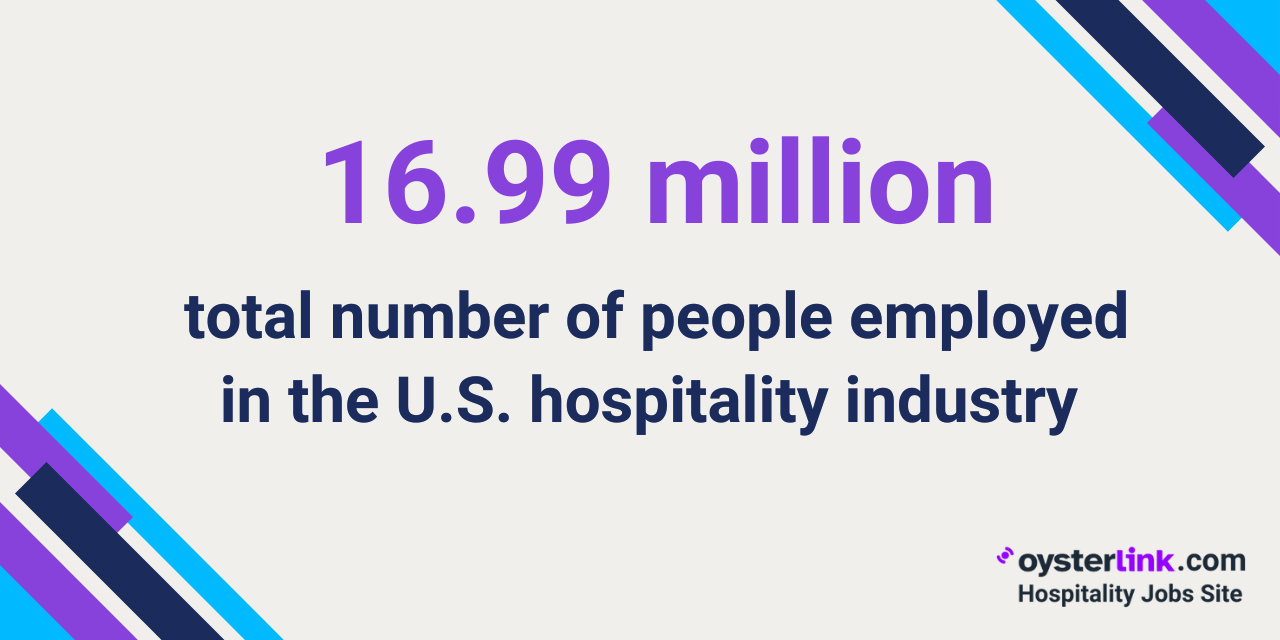
- Overall hospitality employment: Latest government data shows the broader leisure and hospitality sector has employed approximately 16.99 million people in the U.S. (Source)
- Restaurant industry employment: The restaurant industry is projected to employ 15.9 million people by the end of 2025, with around 200,000 new jobs added. (Source)
- Hotel industry employment: The hotel industry directly employed over 2.15 million individuals in 2024, and this number is expected to rise to over 2.17 million in 2025. (Source)
- Openings in hospitality: However, the leisure and hospitality sector also experienced a decrease in job openings from 1,177,000 in March 2024 to 985,000 in March 2025. This 16.31% decrease suggests a potential shift in hiring trends within this larger category. (Source)
- Layoffs in hospitality: The number of layoffs and discharges in the sector was around 146,000 in March 2025, down from 282,000 in December 2024 and 303,000 in November 2024. These numbers point to potentially more stable employment. (Source)
- Union presence in hospitality: In 2024, about 3% of wage and salary workers in the leisure and hospitality industry were union members, with 3.4% represented by unions.
- Wage growth: The top three hospitality roles with the highest year-over-year wage increases are Bartender (7.52%), Baker (5.95%) and Receptionist (5.17%).
Hotels and Lodging
Here, we’ll cover key trends and statistics that highlight the performance and outlook of the U.S. hotel industry.
- Recent data shows there are over 116,873 hotels and motels across the country. These establishments collectively offer an estimated 5.3 million guest rooms nationwide. (Source)
- The hotel and broader lodging industry — which also includes vacation rentals — accounts for $660 billion added to the GDP annually. (Source)
- Hotels also play a major role in local economies by creating jobs, attracting visitors and driving spending.
- This year, the industry is expected to generate $55.46 billion in state and local taxes (a 2.76% increase from 2024) and contribute $30.14 billion in federal taxes (up 2% from the previous year).
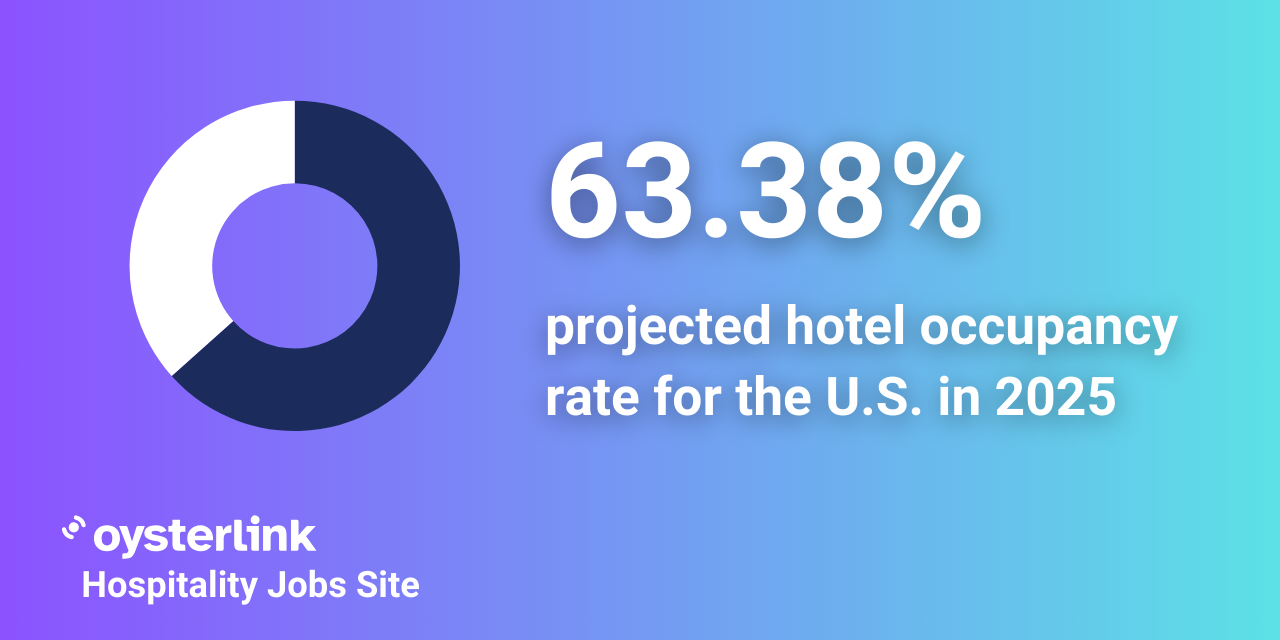
- Hotel occupancy is projected to reach 63.38% in 2025, slightly below the 65.8% recorded in 2019 but a significant improvement over 43.8% in 2020. (Source)
- Luxury hotels have the highest occupancy rate by category at 78%, driven largely by a 34% increase in demand among high-net-worth travelers. (Source)
- Meanwhile, New York City leads all U.S. cities with the highest overall hotel occupancy rate of 84%.
- The average daily rate (ADR) for U.S. hotels will increase in 2025, reaching a new high of $162.16 — which is 1.99% higher than the 2024 rate.
- The increase in the ADR that businesses charge for their services is expected to drive growth in the hotel industry. This means that strategies focusing on adjusting prices and offering better value will be crucial for businesses in the U.S. hospitality sector to succeed.
- Meanwhile, the revenue per available room (RevPAR) is anticipated to reach a nominal high of $102.78 in 2025, surpassing the previous year’s $100.19.
- Boston is currently the most expensive city for hotel stays. There, the average price of the least expensive double room at centrally located, three-star or higher hotels is $320 per night.
- On the other hand, Las Vegas is the city with the highest number of hotel rooms. It has approximately 154,670 hotel rooms. (Source)
Hotel Market Dynamics in Leading US Cities | ||
| City | Statistic | Details |
| New York City | Highest hotel occupancy rate | 84% overall occupancy rate |
| Boston | Most expensive hotel stays | Average price of $320 per night for least expensive double room at centrally located 3-star+ hotels |
| Las Vegas | Most hotel rooms | Approximately 154,670 hotel rooms |

Guest Spending, Travel Habits and New Tech in Hotels
The following statistics show how guest preferences and technology are changing the way hotels operate and earn in 2025.
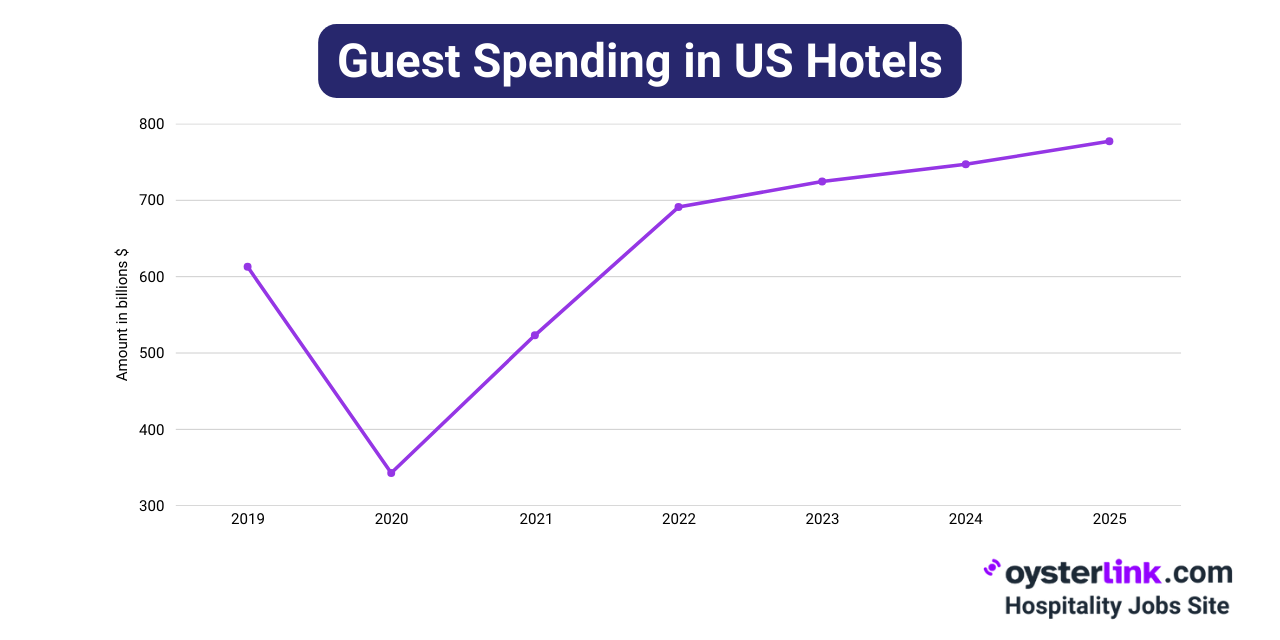
- Guest spending in U.S. hotels is set to achieve a record high of $777.25 billion in 2025. This projected figure would surpass the previous record of $747.17 billion from 2024.
- Meanwhile, total domestic travel spending in the U.S. amounted to $1.3 trillion in 2024, up from $1.2 trillion in 2023. Leisure travel accounts for over $900 billion of this expenditure. (Source)
- As of early 2025, the group travel segment continues to bolster hotel performance. Major hotel chains have reported significant increases in group bookings, with Marriott International noting a 6% year-over-year rise in group revenues as of late 2024. (Source)
- Similarly, Hyatt Hotels Corp. observed a 7% increase in group bookings compared to the previous year. (Source)
- Remote work and the digital nomad lifestyle are changing travel habits, with 58% of business travelers combining work and leisure through “workcations.”
- Hotels that cater to this trend are seeing strong returns. For instance, revenue from extended stays of 14 nights or more is up by 27%.
- 86% of hotel owners and managers consider property management systems the most essential tech for daily operations, followed by revenue management systems and channel managers. (Source)
- Hotels are increasingly using AI-powered tools to improve operations and guest service. About 89% of properties now use AI for customer service, helping reduce response times by 73%.
- Additionally, around 64% of hotels use AI to schedule housekeeping, which has cut room turnover time by 41%.
- Mobile check-in and check-out has become a top priority for travelers, with 53.6% ranking it the most important tech feature they expect during a hotel stay. (Source)
Restaurants and Food Service
In this section, we’ll break down the key trends and data points shaping the U.S. restaurant industry’s performance and future outlook.
- The U.S. currently has over 1 million restaurant and food service outlets.
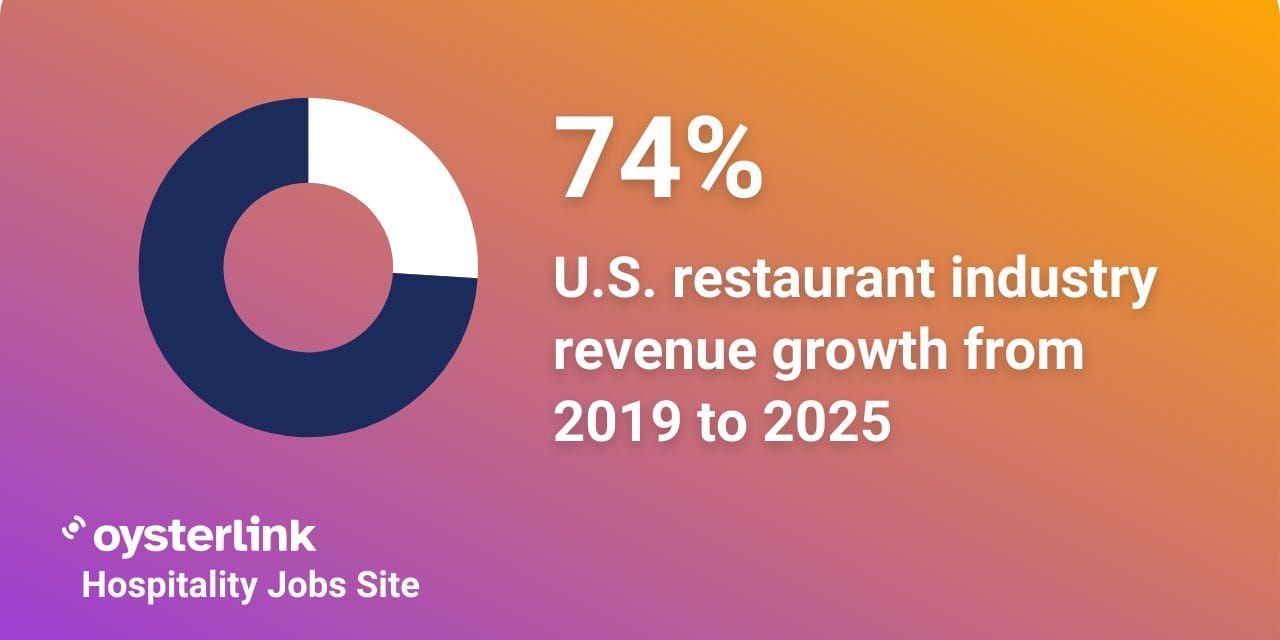
- The 2025 revenue projection of $1.5 trillion marks a significant 74% increase from the 2019 revenue of $864 billion, reflecting the restaurant industry's strong recovery and growth.
- Full-service restaurants have an average profit margin of approximately 9.8%. (Source)
- Meanwhile, fast food places and quick-service restaurants (QSRs) have a $330.56-billion projected market size for 2025.
- In early 2025, food prices rose by about 6.2% year-over-year, prompting many restaurants to increase menu prices in order to maintain profitability. (Source)
- To maintain profitability amid rising costs, 47% of restaurant operators have increased menu prices. (Source)
- 54% of QSR customers and 41% of full-service patrons consider loyalty programs important when choosing where to dine. (Source)
- Restaurants with loyalty programs have observed that loyalty check averages are 5% higher than non-loyalty check averages, indicating the effectiveness of such programs in boosting sales.
- Over 60% of restaurant operators plan to invest in front-of-house technologies, such as kiosks and reservation systems, to enhance customer experience and operational efficiency. (Source)
- QR code menus continue to be widely used, especially in full-service restaurants, where they’ve reached an 87% adoption rate. On average, these help reduce service times by 14 minutes.
Cruise Lines and Airlines
Below are key 2025 statistics highlighting the performance of the cruise and airline industries, both of which are integral to the broader hospitality landscape
- Cruise industry market size: The U.S. cruise market generated approximately $3.67 billion in revenue in 2024 and is projected to reach $7.58 billion by 2030, reflecting a CAGR of 12.9% from 2025 to 2030. (Source)
- Top cruise segment: Ocean cruises generated the largest revenue in 2024 among the different segments.
- Global market breakdown: In terms of revenue, the U.S. accounted for 41.3% of the global cruise market in 2024.
- Cruise passenger growth: Around 19 million Americans are expected to embark on ocean cruises in 2025. This marks a 4.5% increase from the previous year and the third consecutive year of record passenger volume. (Source)
- Cruise line workforce: U.S.-based cruise line operators are projected to employ 20,411 people in 2025, up from 19,838 in 2024. (Source)
- Cruise guest demographics: The average age of cruise passengers in the U.S. is 46. (Source)
- Top cruise-booking generations: Baby Boomers and Gen X are the most frequent cruise bookers, each accounting for 24%.
- New-to-cruise bookings: About 1 in 4 (27%) cruise passengers in the last two years were new to cruising.
- Airline staffing: Meanwhile, domestic passenger airlines in the U.S. are projected to employ 583,277 people in 2025, up from 576,876 in 2024. (Source)
- Airline passenger growth: Domestic air travel passenger numbers are projected to reach 850 million in 2025, a 3.5% increase from 2024. (Source)
- In-flight catering market: The North American in-flight catering services market is valued at approximately $3.11 billion for 2025, with projections indicating a CAGR of 12.86% from 2025 to 2033. (Source)
- Lounge access demand: A survey found that 71% of travelers want more airport lounge options, and 70% prefer a single app to access all services. (Source)
Check Our Career Growth Tools
Event Planning and Venues
The following 2025 statistics provide insights into the event planning industry, which spans corporate functions, social gatherings, conventions and conferences and other hospitality-driven experiences.
- Event planning market growth: The broader U.S. event planning industry is on track to surpass a market value of $2 trillion by 2028. (Source)
- Wedding services market size: This market — which comprises event professionals, venues and caterers — is currently valued at $64.93 billion. It is also expected to reach $95.35 billion by 2030, with a 6.8% CAGR. (Source)
- Exhibition and convention industry: Meanwhile, the North American exhibition, convention and meeting market size is currently estimated at $12.7 billion. (Source)
- Event planning employment: Currently, about 149,000 people work in the event planning industry, with an expected 16,500 job openings each year, on average, over the next decade. (Source)
- Workforce demographics: The event planning industry is notably female-dominated, with women comprising 79% of the workforce compared to only 21% men.
- Job growth: An OysterLink study found that Event Planners are experiencing a significant job growth rate of 10.27%, signaling rising demand across the industry.
- Event volume: Approximately 41% of event professionals are hosting more events in 2025 compared to the previous year, with 94% either maintaining or increasing the number of events they host. (Source)
- Most popular event type: Community and consumer events top the list in 2025, with 59% of Event Planners having these on their calendars.
- Catering share in weddings: As of 2024, nearly a third (32.23%) of total wedding services market revenue came from catering.
- Convention center traffic: Visitor traffic in 2024 was 3.3% higher than in 2023, indicating a positive recovery trend. However, this traffic is still 11.2% lower than in pre-pandemic 2019. (Source)
- Event marketing budgets: On average, businesses dedicate 14% of their marketing budgets to event marketing — highlighting how important live events remain for brand visibility.

Recreation Clubs and Membership Facilities
Here’s a look at U.S. statistics for country clubs, sports centers and other similar facilities.
- Recreation clubs market size: The overall U.S. recreation clubs market was valued at $60.71 billion in 2024 and is projected to grow 6.8% to $64.84 billion in 2025. It’s expected to continue expanding, reaching $86.9 billion by 2029 with a CAGR of 7.6%.
- Total number of country clubs and golf courses: There are currently around 8,730 country clubs and golf courses in the U.S., most of which are private or semi-private. (Source)
- Country club industry revenue: This industry is projected to reach an estimated $34.9 billion in 2025.
- Country club employment figures: There are approximately 308,000 people employed in country clubs across the country.
- Regional growth drivers: Golf courses and country clubs thrive in the Southeast due to its favorable year-round climate. The warm weather means fewer days lost to bad conditions, drawing many golf enthusiasts to the area.
- Fitness facility membership: In 2024, a record 77 million Americans were members of health clubs, gyms, studios or other fitness facilities. (Source)
- Total fitness facility users: When including nonmembers who also use these facilities, the total number of fitness customers reaches nearly 96 million, about 31% of the population.
- Fitness membership growth: Between 2019 and 2024, U.S. fitness facility membership grew by 20%, reflecting increased demand for wellness and recreational amenities — an important trend for hospitality venues offering fitness services.
- Age demographic for fitness facilities: The largest age group of fitness facility members is typically between 18 and 34 years old. (Source)
- Leading facility types by total members: Among all fitness facilities, studios had the largest membership in 2024, with 23.1 million members. Fitness-only clubs followed closely, with 22.2 million members.
- Studio class preferences: Mind-body classes like yoga and Pilates currently make up 30% of studio memberships. (Source)


Loading comments...