Restaurant Spending: Key Takeaways
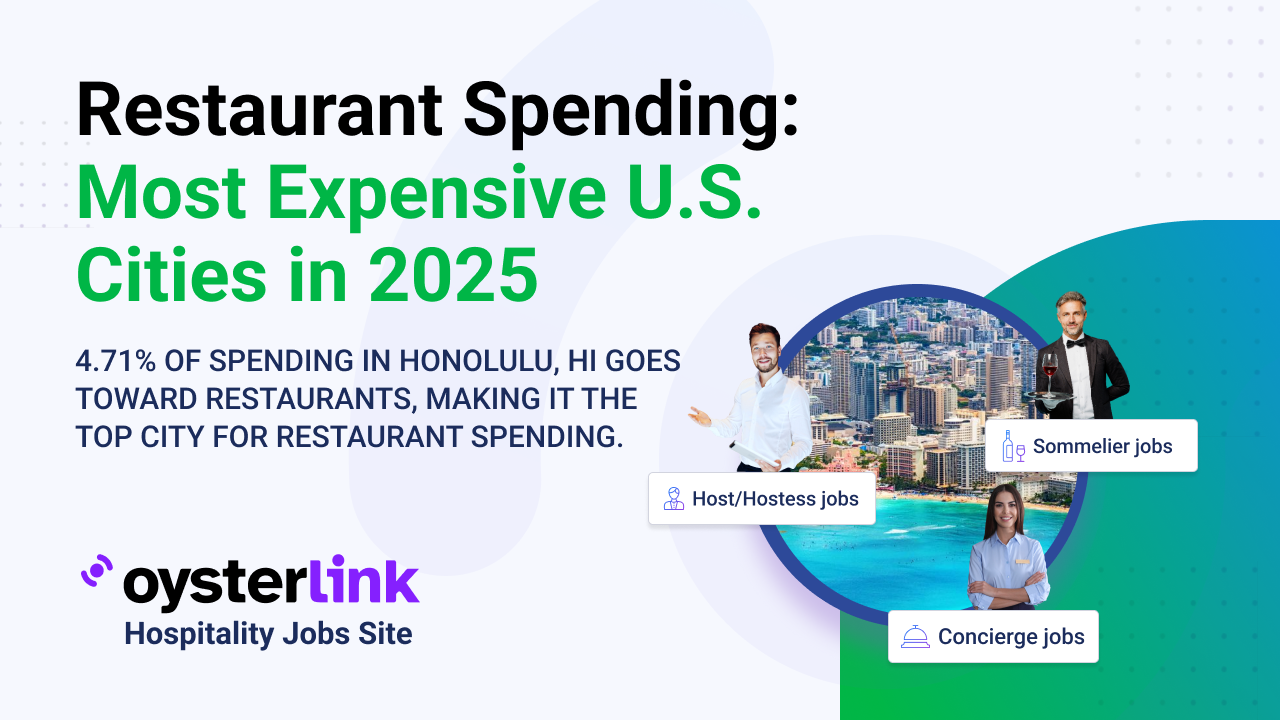
- Honolulu ranks #1 in restaurant spending, with residents allocating 4.71% of their annual expenditures.
- Los Angeles residents spend on average $3,082 annually at restaurants, equating to 4% of their yearly expenditures.
- Boston leads the nation in per capita restaurant spending, with each resident spending an average of $59,392.
Restaurant spending is on the rise. From total dollars spent to how much of their income goes toward dining out, the differences between cities are striking.
In this article, we will break down the top cities where residents are splurging the most on meals away from home.
Cities With the Highest Restaurant Spending in the U.S.
Dining out has long been a reflection of lifestyle and local culture, but in 2025 it’s also a clear marker of economic behavior.
Across the U.S., cities differ not just in what’s on the menu, but in how much residents are willing — or able — to spend on restaurant meals.
Here's a closer look at the cities where restaurant spending is highest — and what those patterns reveal.
1. Honolulu, HI

- Annual restaurant spending: $3,528
- Percentage of annual expenditures: 4.71%
- Percentage of pre-tax income: 3.14%
Honolulu residents spend the highest percentage of their total budgets on eating out.
Given Hawaii’s high cost of living and its strong tourism-driven restaurant industry, it’s no surprise that locals allocate such a large share of their income to dining.
Whether it’s fresh seafood, poke bowls or fine dining experiences, eating out in Honolulu isn’t just a meal — it’s a lifestyle.
2. Los Angeles, CA

- Annual restaurant spending: $3,082
- Percentage of annual expenditures: 4%
- Percentage of pre-tax income: 3%
Los Angeles has one of the most diverse and trend-driven food scenes in the country.
Whether it’s high-end Michelin-starred restaurants, trendy vegan cafes or legendary taco trucks, Angelenos are spending big on food.
The city’s vibrant social scene and entertainment-driven culture also contribute to its high restaurant spending.
3. Dallas-Fort Worth, TX
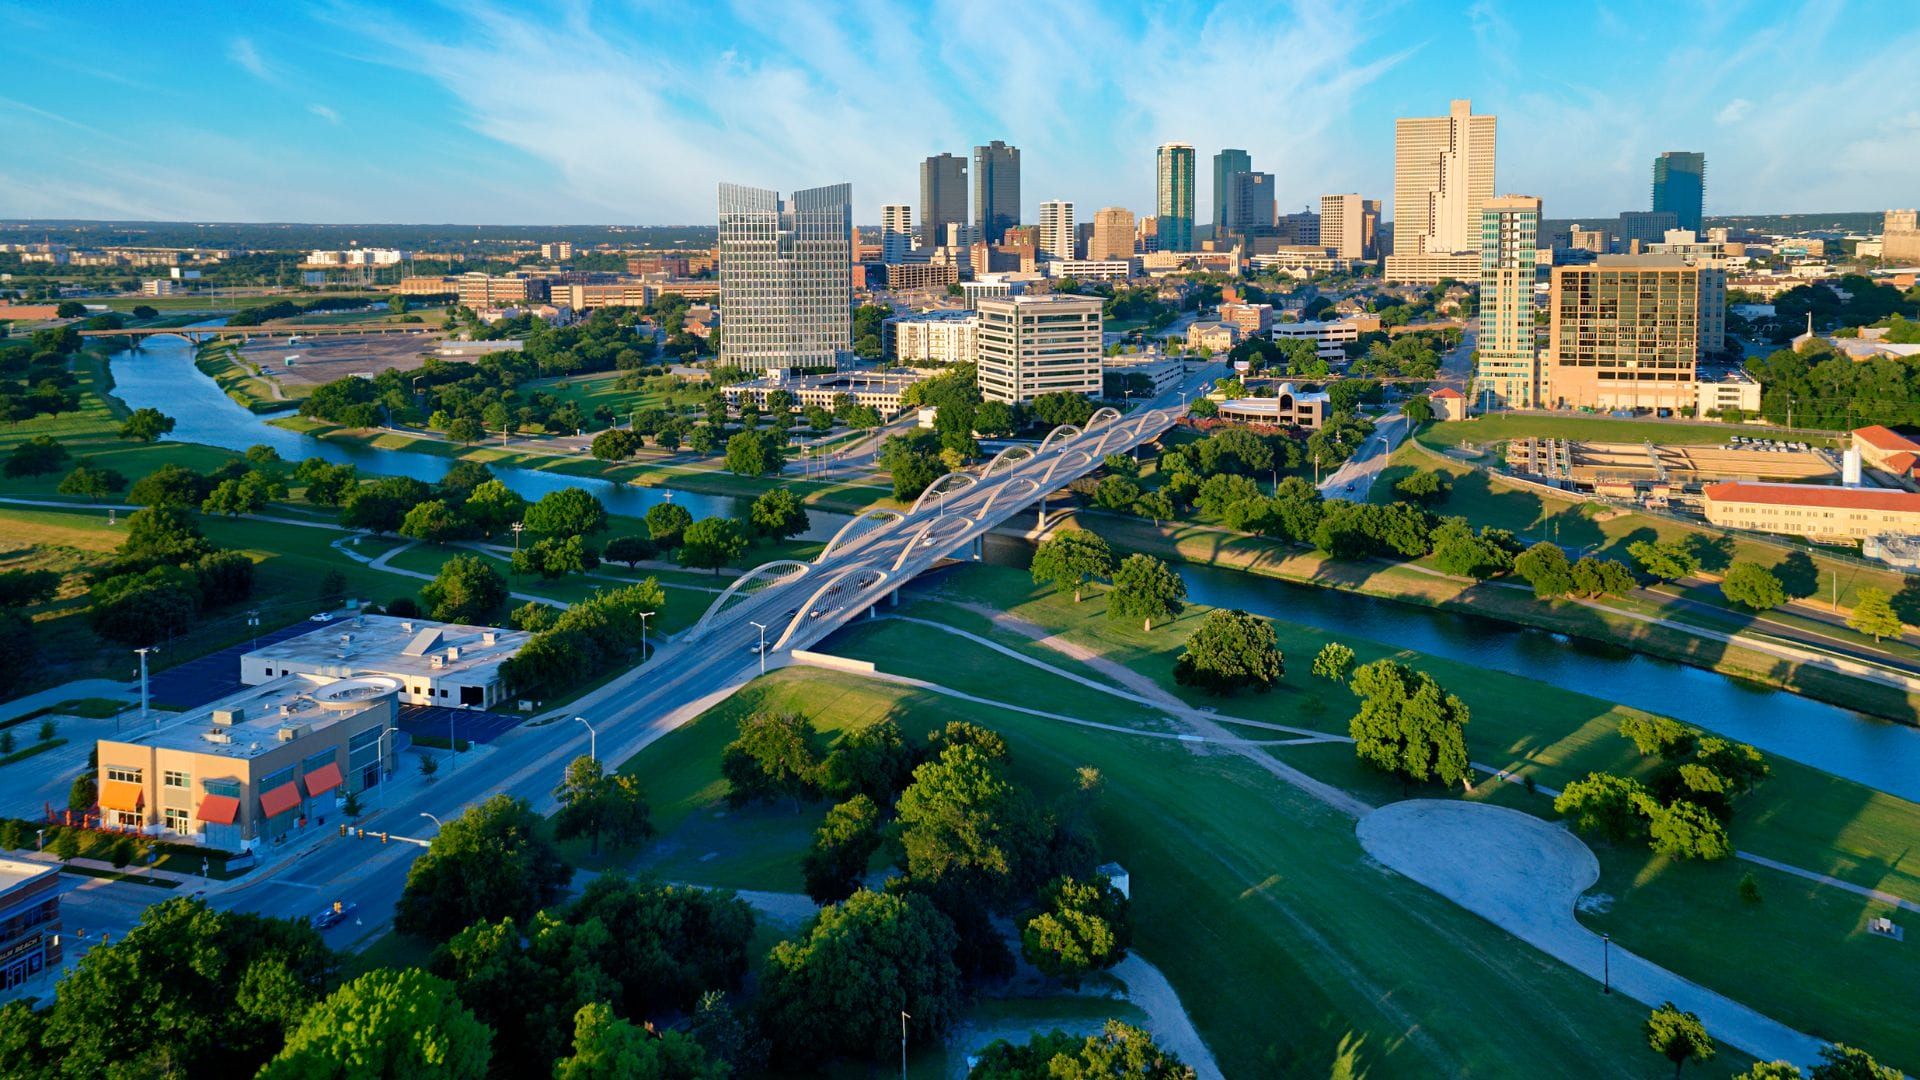
- Annual restaurant spending: $2,720
- Percentage of annual expenditures: 3.78%
- Percentage of pre-tax income: 2.74%
Everything is bigger in Texas — including budgets spent on dining out.
Residents of the Dallas-Fort Worth metroplex are known for their love of steakhouses, barbecue joints and Tex-Mex dining.
A strong economy and relatively affordable living costs allow Texans to indulge in their favorite meals more often.
4. Baltimore, MD
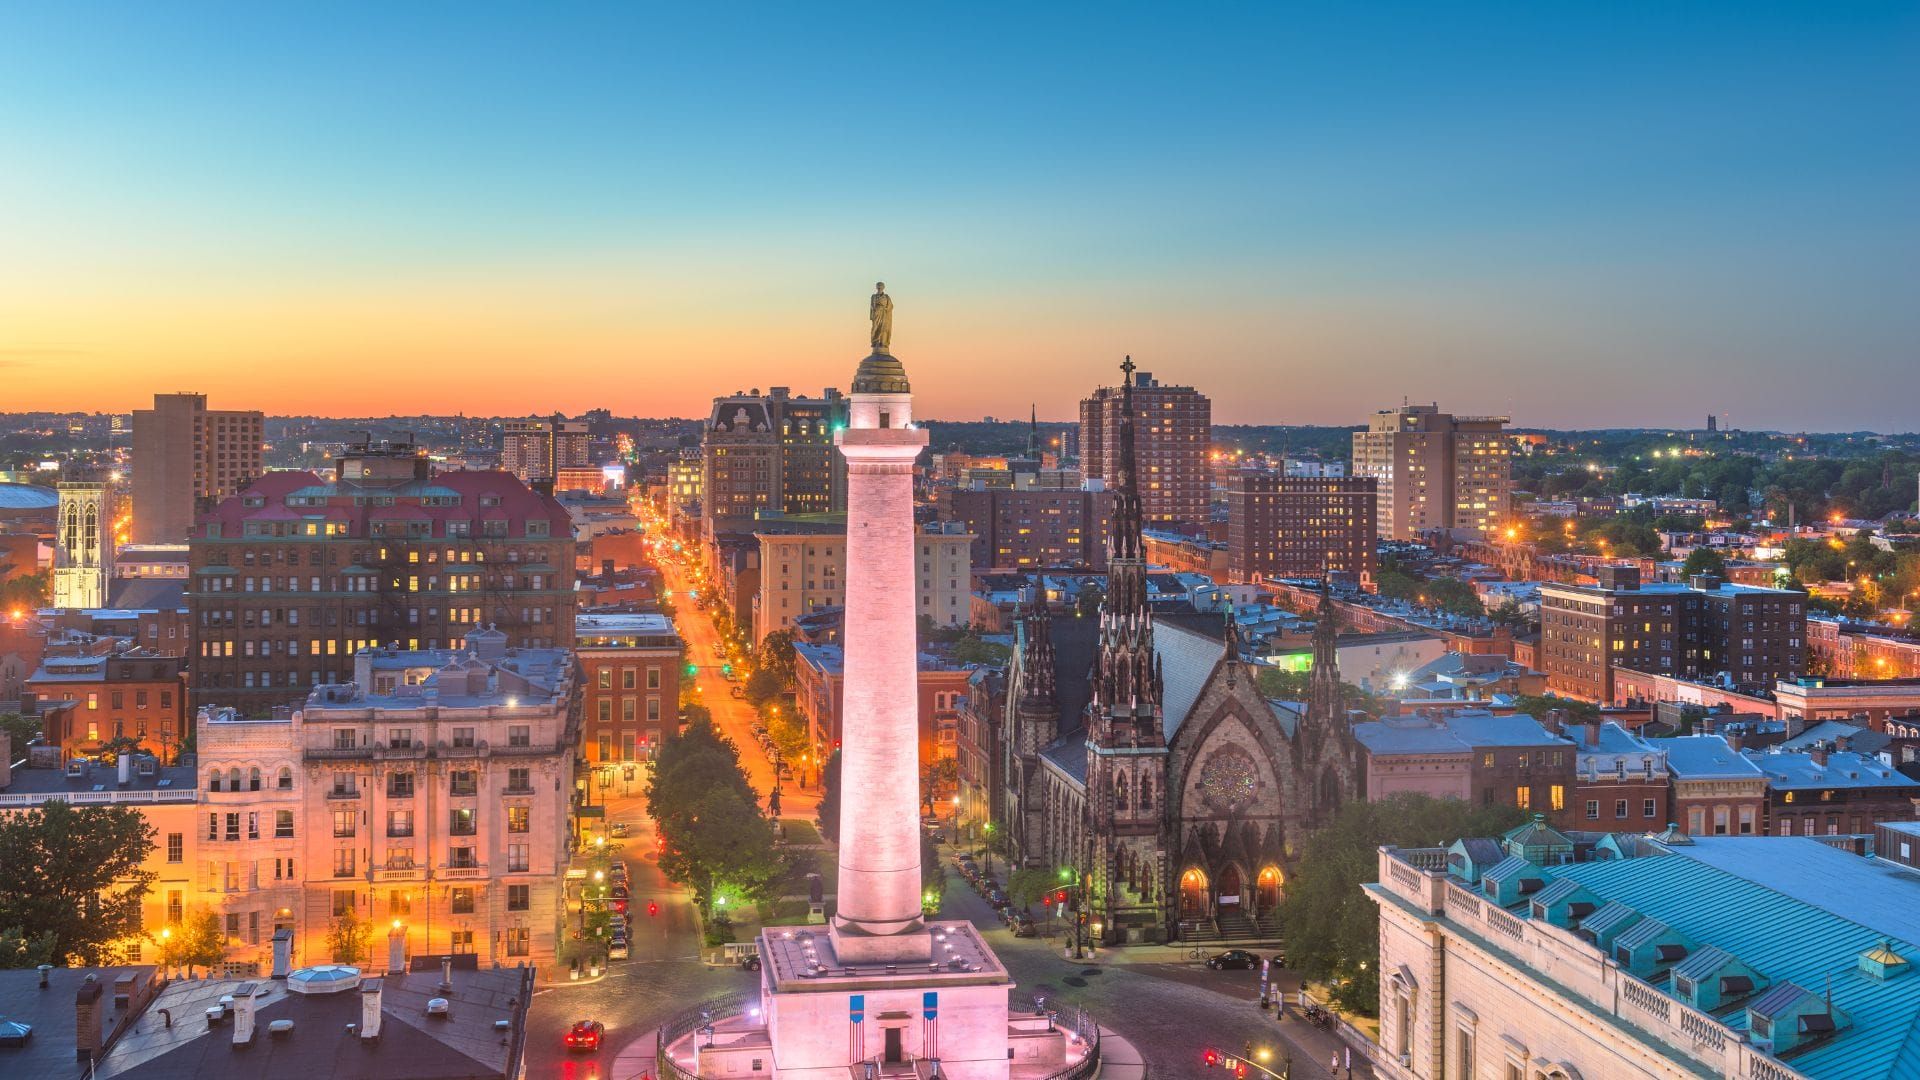
- Annual restaurant spending: $3,077
- Percentage of annual expenditures: 3.75%
- Percentage of pre-tax income: 2.76%
Baltimore’s food scene — famous for crab cakes, fresh seafood and historic eateries — makes eating out a top priority.
Residents dedicate a significant portion of their budget to restaurant dining, reflecting a culture that values both casual and fine dining experiences.
5. Denver, CO

- Annual restaurant spending: $3,111
- Percentage of annual expenditures: 3.69%
- Percentage of pre-tax income: 2.70%
Denver’s booming economy and growing food scene mean that residents are spending more than ever on dining out.
With craft beer, farm-to-table restaurants and a thriving brunch culture, the Mile-High City has become a hotspot for food lovers willing to splurge on quality meals.
Which Cities Have the Highest Consumer Spending Restaurants Share?
Some cities allocate a larger share of their income to dining out than others.
This table shows how restaurant spending compares to residents’ overall earnings:
Why Some Cities Have Higher Restaurant Spending
Another way to measure restaurant spending is by percentage of total annual expenses.
In cities where food culture plays a key role, residents dedicate a larger share of their budget to eating out.
Biggest Restaurant Spenders Per Capita
When looking at per capita spending, which considers the amount spent per person, Boston tops the list:
Why Are Some Cities More Expensive for Dining?
Several factors contribute to higher restaurant spending in certain U.S. cities:
- Cities like Honolulu, Los Angeles and San Francisco naturally have higher menu prices.
- Cities with thriving restaurant scenes and diverse cuisine options encourage more spending.
- Locations like Honolulu have large hospitality industries, boosting restaurant sales.
- Those living in cities like San Francisco tend to have high incomes, allowing them to dine out more frequently.
No matter where you live, eating out is a luxury that comes at a price.
Source: Holli Coffee
Conclusion: Restaurant Spending Keeps Climbing
Dining out has become more than just a convenience — it’s a cultural experience and, in many cities, a way of life.
While cost of living, income levels and food scenes shape how much Americans spend at restaurants, one thing is clear: the appetite for eating out isn’t slowing down anytime soon.
The bottom line is: Americans are willing to pay the price for their favorite meals — and in 2025, that price is higher than ever.

Written by Lidija Misic
Lidija holds a BA in English Language and has lived in five different countries, where she has worked in various roles, including as a flight attendant, teacher, writer and recruiter. Her biggest passion is crafting great content and reading. She is particularly passionate about creating punchy copy that inspires people to make positive changes in their lives.
.webp)
.webp)