Restaurants in San Francisco: 3 Key Takeaways
- San Francisco has approximately 3,900–4,000 licensed food establishments.
- Google Maps lists about 3,234 restaurants in SF, while TripAdvisor lists 5,639.
- About 90–97% of SF restaurants are independently owned, with strict limits on chain/franchise expansion.
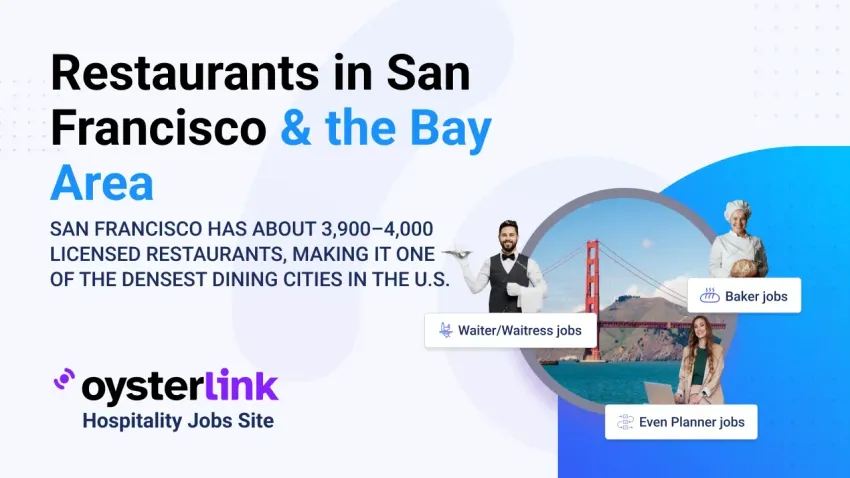
Restaurants in San Francisco number about 3,900–4,000 licensed establishments, making the city one of the nation’s densest and most independent dining hubs.
Nearly all are locally owned, with chains tightly limited, and counts vary across sources like Google Maps and TripAdvisor.
Official Counts of Restaurants in San Francisco from City and State Sources
The most reliable data on restaurant and bar counts comes from city tax records and regional economic reports.
San Francisco (City)
As of late 2023, San Francisco had about 3,932 food-service establishments—a 5% decline from 4,116 in 2019 (pre-pandemic).
City reports show a similar drop: the Accommodation and Food Services sector fell from ~4,300 establishments pre-pandemic to ~4,000 by the end of 2021.
.png)
Broader Bay Area
The Bay Area hosts an estimated 15,000–18,000 dining establishments (restaurants, cafés, bars).
San Francisco alone (~3,800+ venues) had nearly as many in 2016 as Santa Clara County, despite its much smaller size.
Major counties like Alameda and Santa Clara likely each support 3,000–4,000 establishments, while Contra Costa and San Mateo are in the high hundreds to thousands.
Employment Context
Restaurants are a major local employer. In San Francisco’s Mission District alone, ~900 retail and restaurant businesses support nearly 5,000 jobs.
Statewide, restaurants provide ~1.4 million jobs (2024, California Restaurant Association), highlighting the Bay Area’s substantial role in this workforce.
The “Other” category includes Education, Healthcare, and Social Assistance, plus several smaller industries (source: California Economic Development Department)
Restaurants in San Francisco on Google, Yelp, and TripAdvisor
Different platforms track restaurants differently, producing varying totals:
- Google Maps (Mar 2025): ~3,234 listings in San Francisco.
- Yelp: search results indicate thousands of listings—likely in the 4,000–5,000 range.
- TripAdvisor (Apr 2025): ~5,639 listings
Overall, Google and Yelp counts (~3k–4k) align more closely with official figures, while TripAdvisor reflects a more expansive category.
| Source | SF Restaurant Count | Notes on Inclusion |
|---|---|---|
| City Controller (Q4 2023) | ~3,932 | Registered food service businesses (restaurants, cafes, bars, food trucks with permits) in San Francisco. |
| Google Maps (Mar 2025) | 3,234 | Listings labeled “restaurant” on Google Maps within SF. Includes many cafes and bars, but may exclude some very small or unlisted businesses. |
| Yelp (2025) | “Thousands” (est. ~4–5k) | All eateries with Yelp pages in SF. Broad range including food trucks, bakeries, etc., but exact count not directly provided. |
| TripAdvisor (Apr 2025) | 5,639 | All dining listings on TripAdvisor for SF. Likely includes many small eateries and possibly some outdated entries. |
Citations note: Each count is drawn from the indicated source. Differences reflect each platform’s coverage and criteria.
Why Restaurant Counts in San Francisco Differ Across Sources
It is normal to see different totals across official records and various online platforms. Key reasons for these discrepancies include:
Definition of “Restaurant”
Official city data counts all licensed food-service establishments—restaurants, fast food, cafés, bars, food trucks, and permitted pop-ups.
Online platforms, by contrast, classify businesses differently. Google may exclude venues tagged only as “café” or “bar,” while TripAdvisor might include dessert shops or breweries.
Inclusion of Non-Traditional Venues
The SF Controller’s tax-based counts include permitted trucks and pop-ups, but these may not appear on Google Maps without a fixed address.
Ghost kitchens further complicate things: one kitchen can launch multiple delivery-only brands, inflating online counts.
Yelp and Google sometimes list them under a host kitchen’s address. These differences create inconsistencies across data sources.
Data Currency and Cleanup
Official records are updated as licenses lapse, so closed restaurants drop off the rolls.
Online platforms lag more: TripAdvisor often retains closed venues, inflating counts, while Yelp and Google are quicker but still imperfect.
Duplicates and misclassifications—such as separate listings for a café and bar in the same space or multiple name versions—add further noise.
Geographical Scope
Counts can also differ by boundaries. Official data tracks only establishments within San Francisco city limits, while platforms may include nearby areas if users tag them as “San Francisco.”
Breakdown by Category of Restaurants in San Francisco
San Francisco’s restaurant landscape can be segmented into several categories:
| Category | Approx. SF Count | Notes (San Francisco) |
|---|---|---|
| Full-Service Restaurants (table-service) | ~2,500 | These include sit-down restaurants with waitstaff, ranging from casual dining to fine dining. |
| Fast Food & Quick-Service (limited-service) | ~1,400 | This category includes counter-service eateries, fast-food outlets, and fast-casual spots. |
| Cafés and Coffee Shops | ~600+ | Coffee-centric and light dining establishments. |
| Bars and Nightlife (Drinking Places) | 442 | Establishments primarily focused on alcoholic beverages (with or without food). |
| Food Trucks & Street Food Vendors | 200–300 (mobile units) | Mobile food units that roam or operate at specific pods/markets. d kebabs to gourmet fusion cuisine. |
| Ghost Kitchens (Delivery-only) | 70+ kitchens (in SF) | Facilities with no dine-in service, producing food for delivery under various brand names. |
| Pop-ups and Seasonal Eateries | Variable (dozens) | Temporary or periodic restaurants, often chef-driven or seasonal. |
Independent Restaurants vs. Chains in San Francisco
A defining feature of San Francisco’s dining scene is the dominance of independent eateries, typically single-location or small local groups.
San Francisco
San Francisco’s policies and culture strongly favor independents. A 2006 law restricts “formula retail,” limiting major fast-food chains to just ~23 outlets citywide.
Even with fast-casual and café chains included, their footprint is modest—one 2017 analysis counted only 296 chain locations versus over 10,000 restaurants broadly.
Bay Area
Outside San Francisco, chains are more visible but independents still dominate, making up an estimated 70–80% of Bay Area restaurants.
Suburban areas mix strip-mall chains with a wide range of independent ethnic eateries, while neighborhood districts across the region remain strongholds of local dining.
Notable Chain Restaurants in San Francisco
In San Francisco, chains are mostly fast-casual spots (Chipotle, Sweetgreen) or coffee chains, while sit-down brands like Olive Garden or Cheesecake Factory are rare and usually near tourist areas.
In the wider Bay Area such chains are more common, though independents restaurants still make up much of the landscape.
Why Independent Restaurants Dominate in San Francisco
High real estate costs, regulations, and diner preference for unique experiences make the Bay Area tough for chains but supportive of independents.
Chains exist, but with less dominance than in most U.S. metros.
Neighborhood-Level Distribution of Restaurants in San Francisco
Restaurant density in San Francisco mirrors population, commerce, and culture, some neighborhoods brim with dining options, while quieter residential areas have far fewer.
Mission District
The Mission is one of SF’s top dining hubs, with hundreds of spots—from taquerias and panaderías to trendy bistros—clustered along Mission and 24th Streets.
SoMa (South of Market)
SoMa is packed with dining clusters around Yerba Buena, the ballpark, and Folsom/Howard, offering everything from upscale lounges to casual lunch spots.
As a mixed-use district, restaurants concentrate near offices and nightlife, with city plans encouraging active ground-floor uses.
Chinatown & North Beach
Chinatown and North Beach are among SF’s densest dining hubs.
Chinatown alone has hundreds of Chinese restaurants, from dim sum houses to seafood spots, while North Beach adds countless trattorias, cafés, and pizzerias.
Downtown / Union Square / Financial District
Downtown SF has one of the city’s highest restaurant concentrations, with delis, salad bars, and hotel dining around Union Square and the FiDi.
The lunch and happy-hour scene shrank post-pandemic, but many spots remain—TripAdvisor lists ~691 in the Union Square area.
Nearby South Beach and the Embarcadero add more options, serving high-rises and waterfront crowds.
Bay Area Neighborhoods
The Bay Area mirrors SF’s pattern: downtown hubs like San Jose, Palo Alto, and Berkeley’s Shattuck Ave are packed with restaurants, while suburbs concentrate eateries in shopping centers.
Density follows people and tourists: San Francisco leads with ~82 restaurants/bars per square mile, far surpassing other counties.
Source: Road Genius
Bay Area Regional Comparisons: Restaurants in San Francisco vs. the Region
The Bay Area hosts an estimated 15k–17k restaurants across nine counties—about 18% of California’s total.
While Los Angeles city alone has more eateries (~6,600), the Bay Area as a region rivals greater LA when all cities are combined.
Conclusion: Restaurants in San Francisco Today
As of 2025, San Francisco has roughly 3,900–4,000 licensed restaurants, bars, and cafés, while broader Bay Area totals run well into the tens of thousands.
Depending on the source, one might cite “about 4,000” (official data) or “5,000+” (TripAdvisor), each reflecting different slices of the scene.
What’s certain is that San Francisco ranks among the nation’s leaders in restaurants per capita, with the Bay Area offering a remarkably diverse dining landscape.


Loading comments...