Restaurant P&L: 3 Key Takeaways
- Prime costs (food, beverage, and labor) typically make up 60% of a restaurant's sales.
- A restaurant's gross profit margin should ideally be around 70%.
- Labor costs are a significant factor in a restaurant’s profitability. Keeping these costs under 30% of total revenue ensures better financial health.
Restaurant P&L is a vital tool for improving profitability and streamlining financial management.
By focusing on key components like food costs, labor expenses, and operating costs, restaurant owners can optimize their financial performance.
This guide will help you create and understand your restaurant profit and loss statement to make smarter business decisions.
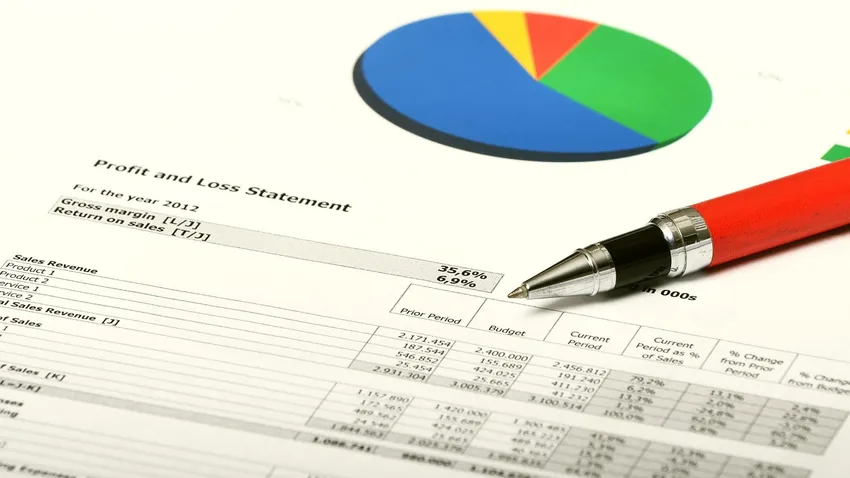
What is a Restaurant P&L Statement and Why It Matters
A restaurant profit and loss statement (P&L) shows exactly where your money comes from and where it goes during specific time periods.
Think of it as your restaurant's financial report card, tracking everything from your daily food sales to monthly operating costs.
Basic components of a P&L
Five key sections make up your restaurant P&L statement.
The sales breakdown reveals your total income streams - food sales, beverage revenue, and other income sources.
Your cost breakdown focuses on the cost of goods sold (COGS), showing exactly what you spend on food and beverage inventory.
Labor costs capture every penny spent on your team — hourly wages, salaries, payroll taxes, and employee benefits.
Operating costs detail your daily business expenses like supplies, repairs, and marketing efforts.
The final piece, net profit or loss, shows what's left after subtracting all expenses from your total income.
Why P&L matters for restaurants
Your P&L statement acts as your financial compass, pointing out what's working and what needs fixing.
Restaurant costs eat up more than 90% of total revenue, making P&L understanding crucial for staying profitable.
This financial tool helps you spot exactly where money flows in your restaurant.
You'll see clear patterns that help forecast sales, understand your limits, and make smart business decisions.
For example, when labor costs jump above 30% of sales, you can quickly adjust your staffing schedule to protect your margins.
Regular P&L review reveals performance patterns across weeks, months and years.
You'll spot seasonal trends and growth opportunities by comparing different time periods.
This knowledge becomes your roadmap for making strategic business improvements.
Setting Up Your First Restaurant Profit and Loss Statement
Restaurant P&L statements need solid organization from day one.
The right setup creates clear financial tracking and makes business analysis straightforward.
Choose your tracking period
Four-week tracking periods give restaurants the most accurate picture of their finances.
While monthly statements work, successful restaurants often choose four-week periods for 13 statements per year.
This method matches weekly business patterns and offers better comparisons between periods.
The four-week system shines when comparing busy days.
Each period captures the same number of weekend days - four Fridays and four Saturdays.
You won't need to adjust for different numbers of weekend days between months, making your analysis more reliable.
Gather financial documents
Your POS system holds the foundation of your P&L statement — detailed sales data for your chosen period. Pull together your:
- Food and beverage sales records
- Inventory purchase details
- Payroll information
- Operating expense receipts
Smart restaurant owners use accounting software instead of manual tracking for their P&L statements.
This choice cuts down on errors and saves valuable time.
Set up sales categories
Your revenue streams need clear organization. Standard categories include:
- Food sales (broken down by menu sections)
- Wine, beer and liquor sales
- Non-alcoholic beverage sales
- Other income sources like catering or events
These categories spotlight your money-makers and show which areas need work.
Organize expense sections
Break your expenses into three main groups: prime costs, fixed costs and operating expenses.
Prime costs — your food, beverage, and labor expenses - typically take up 60% of total sales.
Fixed costs cover predictable expenses like rent, insurance and permits.
Operating costs handle daily needs — supplies, repairs, marketing and entertainment. This organization helps you spot spending patterns and keep costs under control.
Restaurant P&L Template (Editable Format)
| Category | Amount ($) |
|---|---|
| Revenue | |
| Food Sales | |
| Beverage Sales | |
| Catering/Event Revenue | |
| Total Revenue | $XX,XXX |
| Cost of Goods Sold (COGS) | |
| Food Cost | |
| Beverage Cost | |
| Total COGS | $XX,XXX |
| Gross Profit | $XX,XXX |
| Operating Expenses | |
| Labor (Wages, Salaries, Payroll Taxes) | |
| Rent/Mortgage | |
| Utilities | |
| Equipment Repairs & Maintenance | |
| Marketing & Advertising | |
| Insurance & Permits | |
| Miscellaneous Expenses | |
| Total Expenses | $XX,XXX |
| Net Profit (Revenue - Expenses) | $XX,XXX |
P&L Statement Breakdown Example for a Small Restaurant
| Category | Amount ($) |
|---|---|
| Revenue | |
| Food Sales | $90,000 |
| Beverage Sales | $25,000 |
| Catering/Events | $5,000 |
| Total Revenue | $120,000 |
| Cost of Goods Sold (COGS) | |
| Food Cost | $25,000 |
| Beverage Cost | $9,000 |
| Total COGS | $34,000 |
| Gross Profit | $86,000 |
| Operating Expenses | |
| Labor (Wages & Taxes) | $36,000 |
| Rent & Utilities | $10,000 |
| Equipment Repairs | $2,500 |
| Marketing & Advertising | $2,000 |
| Insurance & Permits | $1,500 |
| Miscellaneous Expenses | $4,000 |
| Total Expenses | $56,000 |
| Net Profit (Revenue - Expenses) | $30,000 |
- Gross profit margin: ($86,000 ÷ $120,000) × 100 = 71.67%
- Net profit margin: ($30,000 ÷ $120,000) × 100 = 25%
Keep an eye on labor costs—they should stay under 30% of total revenue.
Track These Key Restaurant Profit and Loss Statement Components
Your restaurant's financial success depends on watching specific P&L elements closely.
Each piece tells its own story about your business performance.
Food and beverage sales
Food sales drive your restaurant's revenue, accounting for 70-80% of total revenue.
Split your tracking between food items, wine, beer, liquor and non-alcoholic drinks to see which products boost your bottom line.
POS systems take the guesswork out of sales tracking through automatic categorization.
You'll spot your menu winners and underperformers by analyzing both broad categories and individual items.
Cost of goods sold
COGS shows what you spend to create menu items - food ingredients, beverages, and preparation materials.
The math stays simple: Beginning Inventory + Purchases - Ending Inventory.
Keep your COGS at or below 31% of your sales. Smart inventory management makes this target achievable.
Count inventory regularly to catch problems early and maintain accurate numbers.
Labor costs and payroll
Your team costs include more than just hourly wages and salaries.
Factor in payroll taxes, workers' comp, health insurance and other benefits. Most restaurants spend about 30% of revenue on labor.
Watch your labor cost per hour across different staff groups.
This number helps you adjust schedules and staffing without hurting guest service.
Operating expenses
Daily business costs include:
- Rent and utilities
- Equipment repairs and maintenance
- Marketing and advertising expenses
- Insurance and permits
- Cleaning supplies and kitchen equipment
- Music and entertainment costs
Smart operators separate fixed and variable costs for better budget control.
Regular expense reviews help find savings opportunities that won't impact your quality standards.
Calculate Important Restaurant P&L Template Metrics
Two key profit calculations tell the real story of your restaurant's financial performance.
These numbers spotlight your business health and growth potential.
Gross profit margin
Gross profit shows the money left after paying for your food and beverage costs. The math works like this: subtract COGS from total revenue.
So, if your restaurant earns $120,000 monthly with $34,000 in COGS, you’re left with a $86,000 gross profit.
Want your gross profit margin percentage? Divide gross profit by total revenue and multiply by 100.
Taking our example: ($86,000 ÷ $120,000) × 100 = 71.67%. Your target should be a gross profit margin of around 70%.
This number reveals how well your sales turn into profit before other expenses kick in.
Net profit calculation
Net profit gives you the bottom line — what's left after paying every bill.
Start with your gross profit, then subtract all operating costs, including labor, rent, utilities and taxes.
Let's run the numbers -your restaurant makes $250,000 in revenue with $100,000 in COGS, giving you $150,000 gross profit.
Take away $130,000 in operating expenses, and you're left with $20,000 net profit.
Find your net profit margin by dividing net profit by total revenue, then multiplying by 100.
Healthy restaurants target a net profit margin between 6% and 10%.
Hitting above 6% shows strong performance in our industry. Regular profit tracking helps you:
- Spot business trends early
- See how you stack up against competitors
- Set smart menu prices
- Map out growth plans
Watch these numbers closely to catch problems before they hurt your bottom line.
These calculations become your roadmap for smarter business decisions and future planning.

The Fastest Growing
Restaurant & Hospitality Job Platform
Looking for top paid jobs? Or Hiring for your business?
Common Restaurant P and L Template Mistakes to Avoid
Smart restaurant owners know the difference between profit and loss often comes down to avoiding basic P&L mistakes.
These common pitfalls can derail your financial tracking and cloud your business decisions.
Mixing personal and business expenses
Combining personal and business finances stands out as one of the costliest mistakes restaurant owners make.
This mixing creates tax reporting nightmares and blurs your view of true business performance.
Your personal assets stay at risk when you blur these financial lines during business difficulties.
The solution starts with separation. Open dedicated bank accounts and credit cards for your restaurant.
This clean break simplifies tax reporting and creates clear financial boundaries.
Your personal credit score stays protected, plus you look more professional to potential lenders and investors.
Incorrect expense categorization
Your P&L accuracy depends on proper expense grouping.
Restaurant owners often swing between too broad or overly detailed categories. Simple categories might seem easier but hide crucial spending patterns.
Strong expense tracking needs clear categories:
- Food and beverage costs
- Labor expenses and payroll
- Operating supplies and equipment
- Marketing and advertising costs
- Utilities and maintenance expenses
Your chart of accounts should tell a clear story - broad enough to group similar items but detailed enough for meaningful insights.
Review these categories regularly to match your current business reality.
Poor record keeping habits
Sloppy bookkeeping kills restaurant profits. Waiting until month-end to record transactions leaves you flying blind.
Real-time data matters for catching problems early and adjusting purchases or schedules quickly.
Daily transaction recording and weekly reconciliation put you in control of your finances.
You'll spot problems early and keep vendor accounts accurate. Good records help you price menu items right and predict potential trouble spots.
Bank statement reconciliation plays a crucial role in accurate books. This step catches missing payments and errors that hurt cash flow.
Many owners skip this vital task, leading to snowballing mistakes that become harder to fix.
Restaurant Profit and Loss Statement Accuracy Checklist
Sales Tracking:
- Are food & beverage sales tracked separately?
- Does your POS system categorize revenue accurately?
- Have you accounted for discounts, refunds, and voided transactions?
COGS Management:
- Is inventory counted regularly (weekly/monthly)?
- Are food & beverage costs staying within industry benchmarks (25-35%)?
- Are supplier invoices reviewed for accuracy?
Labor & Payroll:
- Are payroll costs staying under 30% of revenue?
- Do scheduling adjustments reflect slow and busy periods?
- Have overtime and benefits been accounted for?
Expense Monitoring:
- Are operating costs categorized correctly?
- Have you reviewed fixed costs (rent, insurance, etc.) for opportunities to save?
- Are there any unexpected expenses impacting net profit?
Final P&L Review:
- Does gross profit margin fall within 65-75%?
- Is net profit margin above 6% (healthy benchmark)?
- Have trends been compared to previous months/years?
The Fastest Growing
Restaurant & Hospitality Job Platform
Looking for top paid jobs? Or Hiring for your business?
Conclusion: Mastering Your Restaurant P&L Template
Strong P&L management separates thriving restaurants from struggling ones.
Keep business money separate from personal funds, sort expenses properly, and maintain detailed records.
Let your P&L numbers guide your choices about menu prices, staff scheduling and business operations.
Restaurant profit margins leave little room for error — sometimes just pennies per dollar make the difference between profit and loss.
Your P&L statement becomes your roadmap to restaurant success when you review and optimize it regularly.

Written by Lidija Misic
Lidija holds a BA in English Language and has lived in five different countries, where she has worked in various roles, including as a flight attendant, teacher, writer and recruiter. Her biggest passion is crafting great content and reading. She is particularly passionate about creating punchy copy that inspires people to make positive changes in their lives.


Loading comments...