Chef Statistics for 2025: Key Takeaways
- There are 182,320 Chefs currently employed in the United States.
- 79% of Chefs are employed full-time while 21% are part-time.
- 63.4% of Chefs are men, while 36.6% are women.
- Chefs earn an average salary of $5,393 per month or $64,720 per year.
We’ve put together these Chef statistics for 2025 that highlight the realities of the profession — from career paths and demographics to economic pressures and industry shifts.
This report breaks down the numbers, providing a data-driven look at the U.S. culinary scene.
Chef Statistics on Employment and Job Outlook in the US
Understanding the scope of the Chef profession requires examining its workforce size and future prospects.
- Most recent data shows there are approximately 182,320 Chefs and Head Cooks* employed in the U.S. (Source)
- There is an average of 24,600 Chef job openings each year over the next decade from 2023 to 2033. These openings will arise from both newly created positions and the need to replace Chefs who leave.
The Fastest Growing
Restaurant & Hospitality Job Platform
Looking for top paid jobs? Or Hiring for your business?


- There is an 8% expected increase in the demand for Chefs within the next few years, which is notably faster than the general average for all occupations. (Source)
- The majority of Chefs — around 100,320, in fact — find work in restaurants and eating places. Coming in second are special food services which employ around 20,940 Chefs.
| Industry | Number of Chefs employed |
| Restaurants and other eating places | 100,320 |
| Special food services | 20,940 |
| Traveler accommodations | 18,490 |
| Other amusement and recreation industries | 9,880 |
| Continuing care retirement communities and assisted living facilities for the elderly | 4,850 |
These data indicate that there’s a good amount of opportunities for both current Chefs and those aiming to become one.
Chef Employment by Location
Job opportunities for Chefs differ across the country, with some states and metropolitan areas having significantly higher employment levels.
These are the top five states when it comes to employment levels for Chefs.
Additionally, here are the five metropolitan areas with the highest employment levels.
| Metropolitan area | Number of Chefs employed |
| New York-Newark-Jersey City, NY-NJ-PA | 15,560 |
| Los Angeles-Long Beach-Anaheim, CA | 10,250 |
| Miami-Fort Lauderdale-West Palm Beach, FL | 6,690 |
| Dallas-Fort Worth-Arlington, TX | 4,660 |
| San Francisco-Oakland-Fremont, CA | 4,490 |
The Fastest Growing
Restaurant & Hospitality Job Platform
Looking for top paid jobs? Or Hiring for your business?
Demographics of Chefs Working in the US
The demographics of the Chef profession offer insights into these individuals shaping most of the culinary industry.
- Approximately 79% of Chefs work full-time, while 21% are part-time. (Source)
- The majority of Chefs are male, accounting for 63.4% of the workforce, while 36.6% are female.
- At the same time, there is a slightly higher interest in becoming a Chef among men (52%) compared to women (48%), with a ratio of 1.10 to 1.
- The average age for male Chefs is 41, and for female Chefs, it is 42.
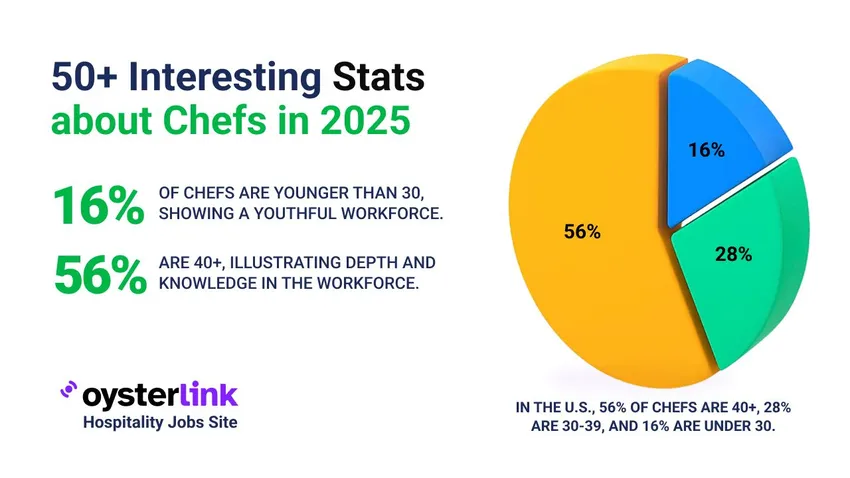
- A significant portion of Chefs in the U.S. (56%) are aged 40 or older. Meanwhile, 28% are 30 to 39 years old, and only 16% are under 30. (Source)
- Approximately 30.89% of Chefs have only a high school diploma or GED, 22.48% have some college education, 16.65% hold an associate’s degree and 11.54% have a bachelor’s degree.
- The three most common degree programs among Chefs who have finished college are Business (16,182 graduates), Personal & Culinary Services (8,918) and Engineering (3,625).
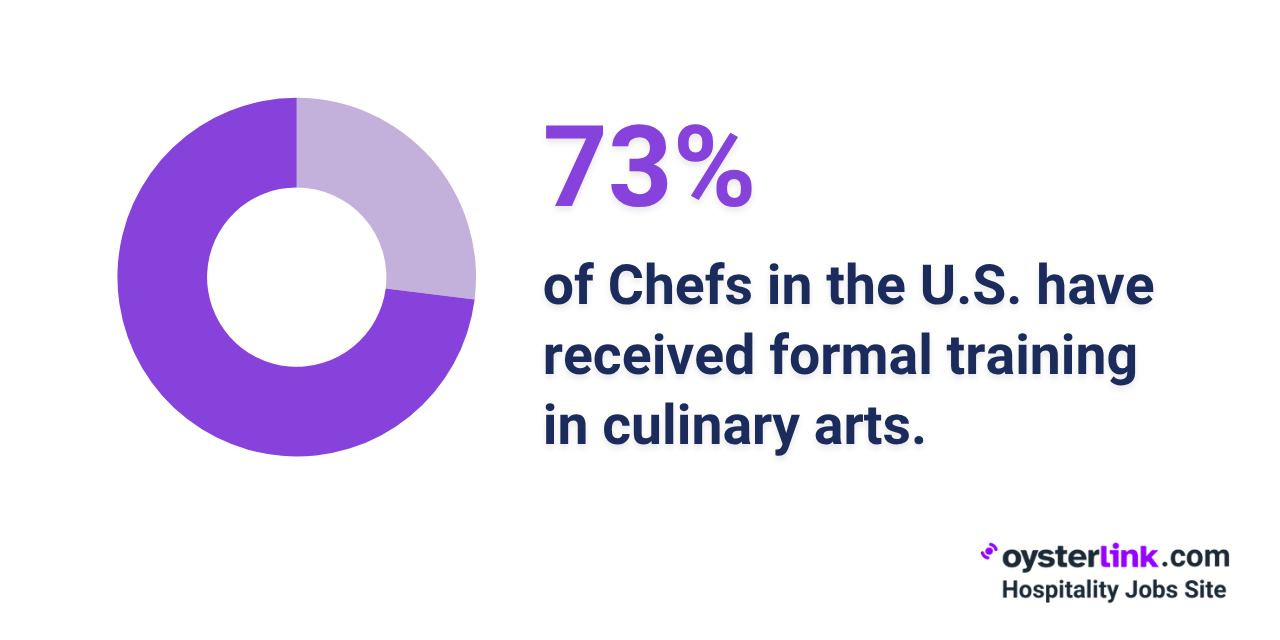
- Although only a high school diploma is typically required to become a Chef, 73% of professional Chefs in the U.S. have attended culinary school or completed formal training.
The Fastest Growing
Restaurant & Hospitality Job Platform
Looking for top paid jobs? Or Hiring for your business?
Chef Statistics on Salary and Overall Income
Chef salaries in the U.S. depend on their experience, geographic location and position or level.
- Recent data shows that the average salary for Chefs is $64,720 per year.

- Plenty of establishments follow a monthly timeline for Chefs’ paychecks. That said, Chefs in general make $5,393 per month, on average.
- The top 10% (or 90th percentile) of Chefs earn around $96,030 yearly.
- Hawaii is currently the highest-paying state for Chefs, with an average salary of $92,690 per year. Rhode Island ranks second at $87,950, followed by the District of Columbia at $79,090.
| State/District | Average Chef salary |
| Hawaii | $92,690 per year |
| Rhode Island | $87,950 per year |
| District of Columbia | $79,090 per year |
| Massachusetts | $75,900 per year |
| New Jersey | $75,020 per year |
- Top-paying areas for Chefs: On a metro area basis, Chefs are likely to earn the highest salaries in Kahului-Wailuku ($97,850 per year) in Hawaii.
| Statistical area | Average Chef salary |
| Kahului-Wailuku, HI | $97,850 per year |
| Hawaii / Kauai nonmetropolitan area | $92,510 per year |
| Urban Honolulu, HI | $90,910 per year |
| Napa, CA | $82,440 per year |
| Providence-Warwick, RI-MA | $81,590 per year |
- Role type: Salaries can also differ significantly based on the Chef’s specific role, as shown in the table below.
| Chef Type | Average salary |
| Executive Chef | $80,040 per year |
| Head Chef | $73,632 per year |
| Private or Personal Chef | $68,493 per year |
| Sous Chef | $56,013 per year |
| Pastry Chef | $54,995 per year |
| Sushi Chef | $58,909 per year |
The Fastest Growing
Restaurant & Hospitality Job Platform
Looking for top paid jobs? Or Hiring for your business?
Job Satisfaction and Challenges Among Chefs
Now, let’s look into the factors that impact the overall experience of Chefs in the industry.
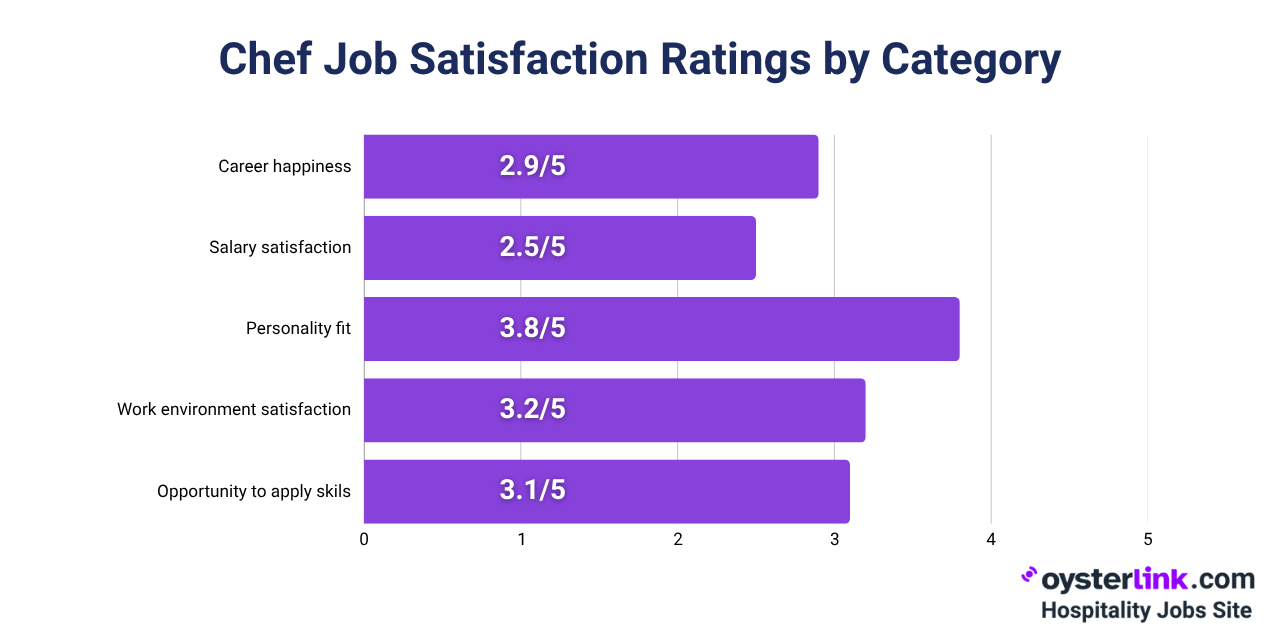
- A study shows that Chefs in general rate their career happiness at only 2.9 out of 5, which is lower than that of similar hospitality careers. (Source)
- On average, Chefs rate their satisfaction with their salaries 2.5 out of 5, showing that many are feeling underpaid for their work.
- Chefs generally find their personalities well-suited to the demands of the job, with a rating of 3.8 out of 5.
- Chefs rate their enjoyment of their work environment at 3.2 out of 5, suggesting a generally neutral sentiment.
- With an average rating of 3.1/5, many Chefs feel their skills are being aptly used on the job.
Understanding these numbers can help identify factors significantly influencing turnover rates within the broader hospitality industry.
Key Data and Trends in the Culinary Industry
Chefs as well as the broader culinary and dining industry are continuously adapting to shifting consumer demands and global influences.
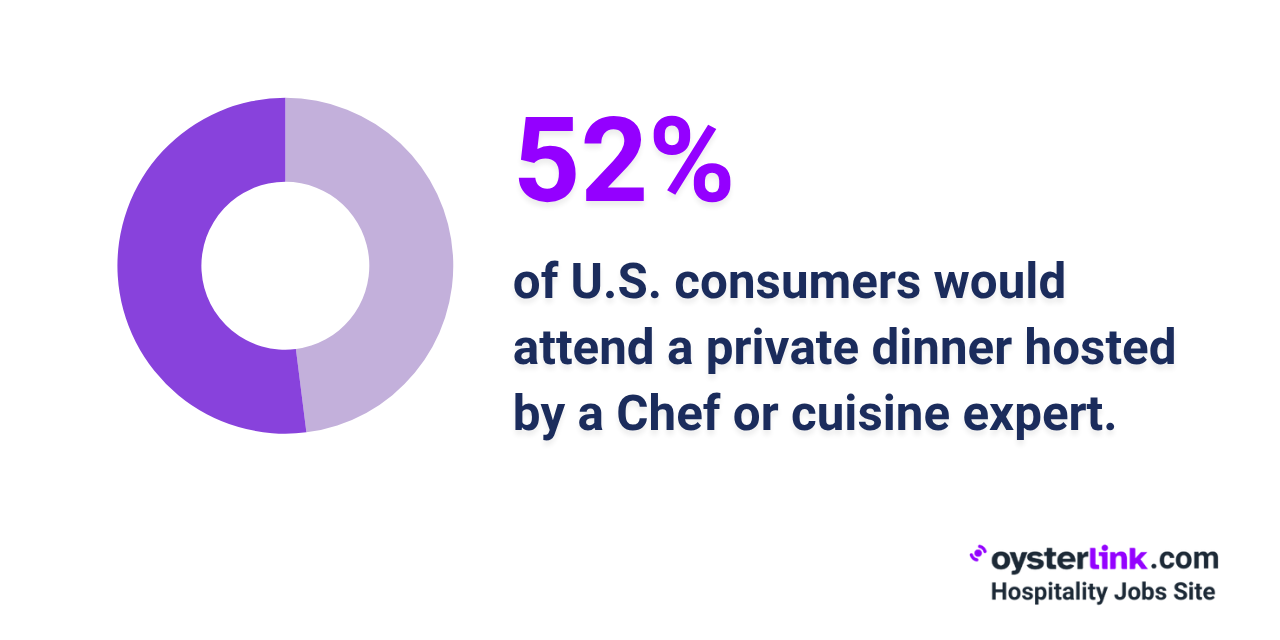
- A recent study reveals that 52% of adult-age U.S. consumers are likely to participate in private dinner events at a restaurant that’s led by a Chef or expert on a specific type of cuisine. (Source)
- The interest in such a type of dining is highest among Gen Z adults (63%) and millennials (60%), while Gen X follows closely at 56%.
- The revenue for plant-based food is expected to reach $75 billion by 2028, at a compound annual growth rate (CAGR) of 10.95%. (Source)
- There has been a 62% growth in plant-based dishes in U.S. restaurants over the last 10 years. (Source)
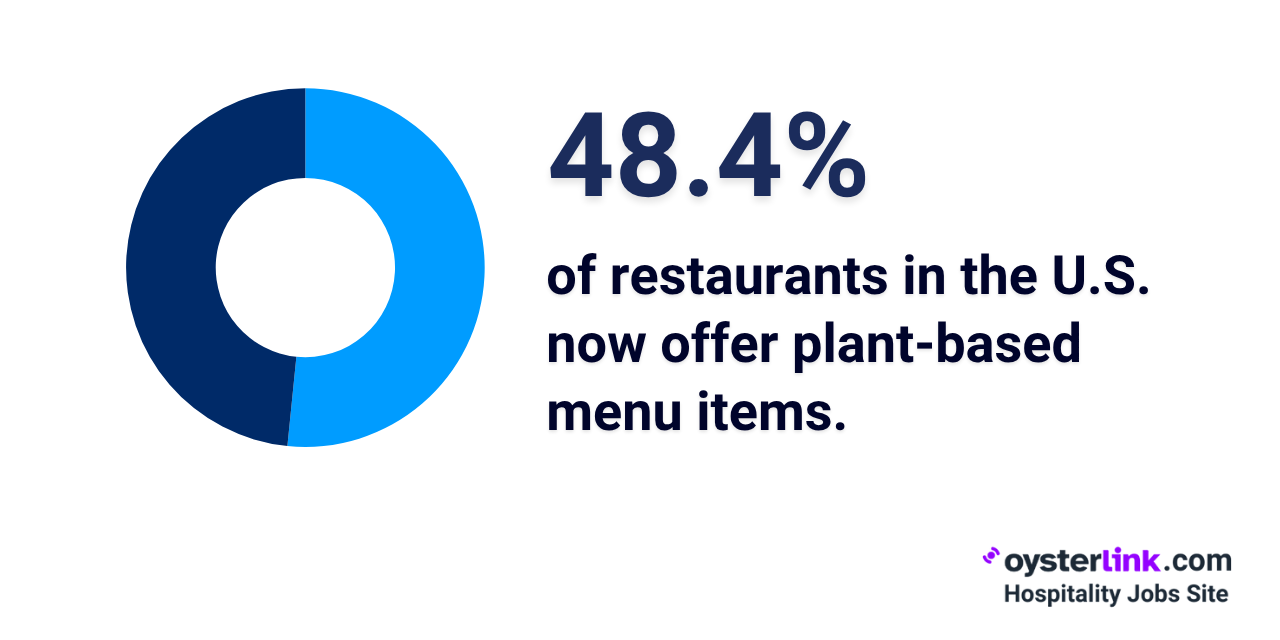
- These options are now found in 48.4% of restaurants across the country, reflecting a broader trend toward healthier eating.
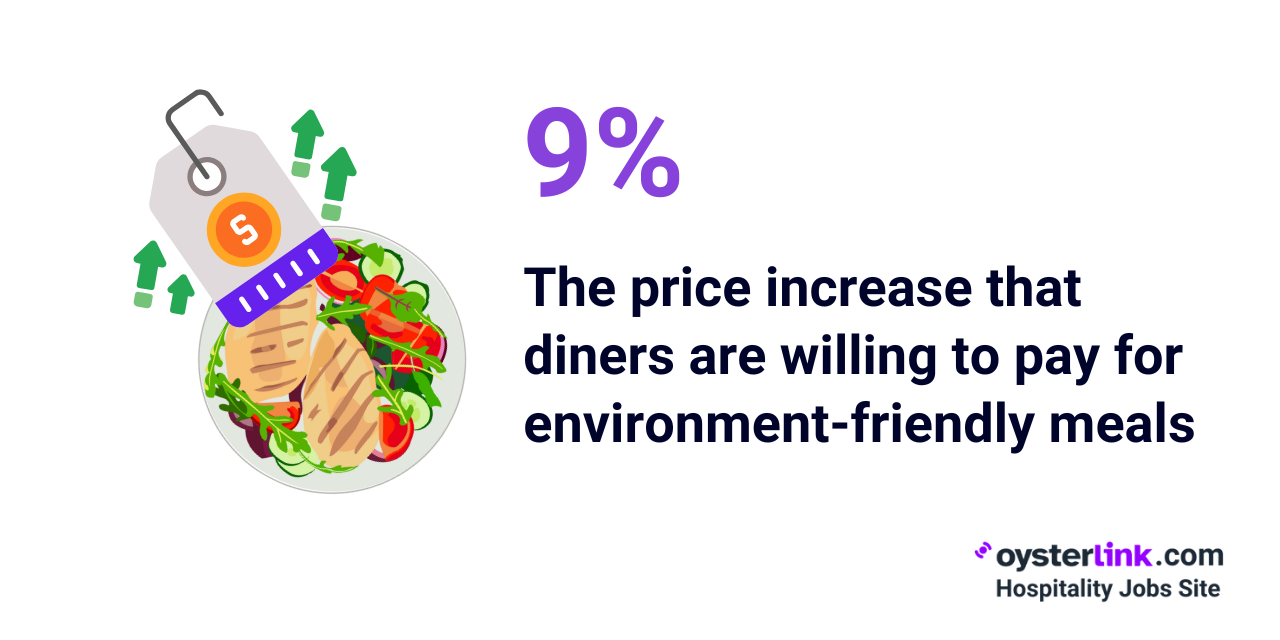
- 90% of diners prefer restaurants with strong sustainable practices and are willing to pay an average of 9% more for a planet-friendly dining experience. (Source)
- Flavor over fuss is another significant trend, with diners seeking authentic and flavorful food prepared with fresh, high-quality ingredients rather than overly complicated presentations. (Source)
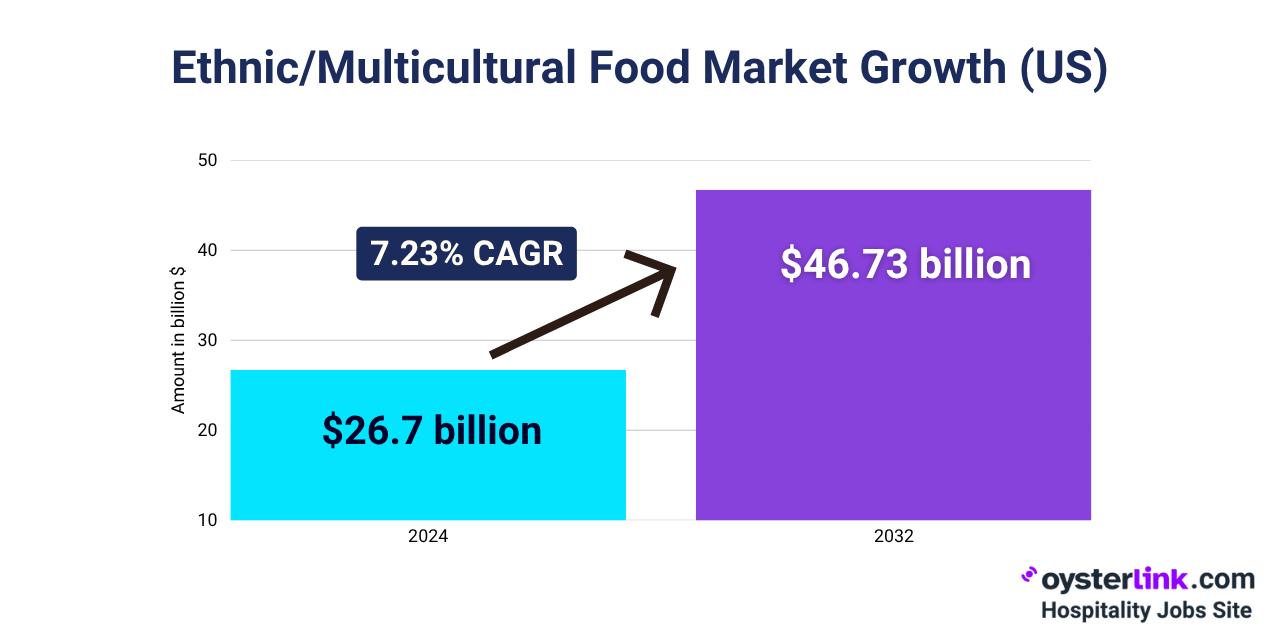
- The U.S. ethnic or multicultural food market is projected to reach $46.73 billion by 2032, growing at a CAGR of 7.23%. (Source)
The Fastest Growing
Restaurant & Hospitality Job Platform
Looking for top paid jobs? Or Hiring for your business?
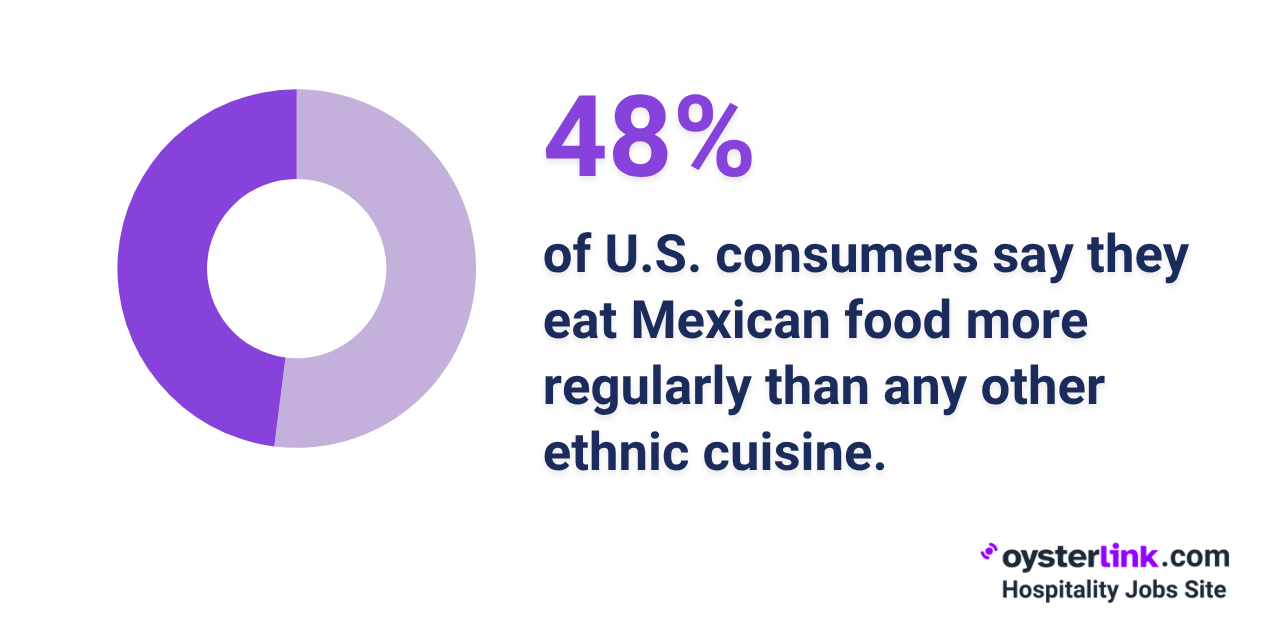
- A recent study shows Mexican food ranks the highest in the U.S., with 48% of consumers saying they enjoy it frequently.
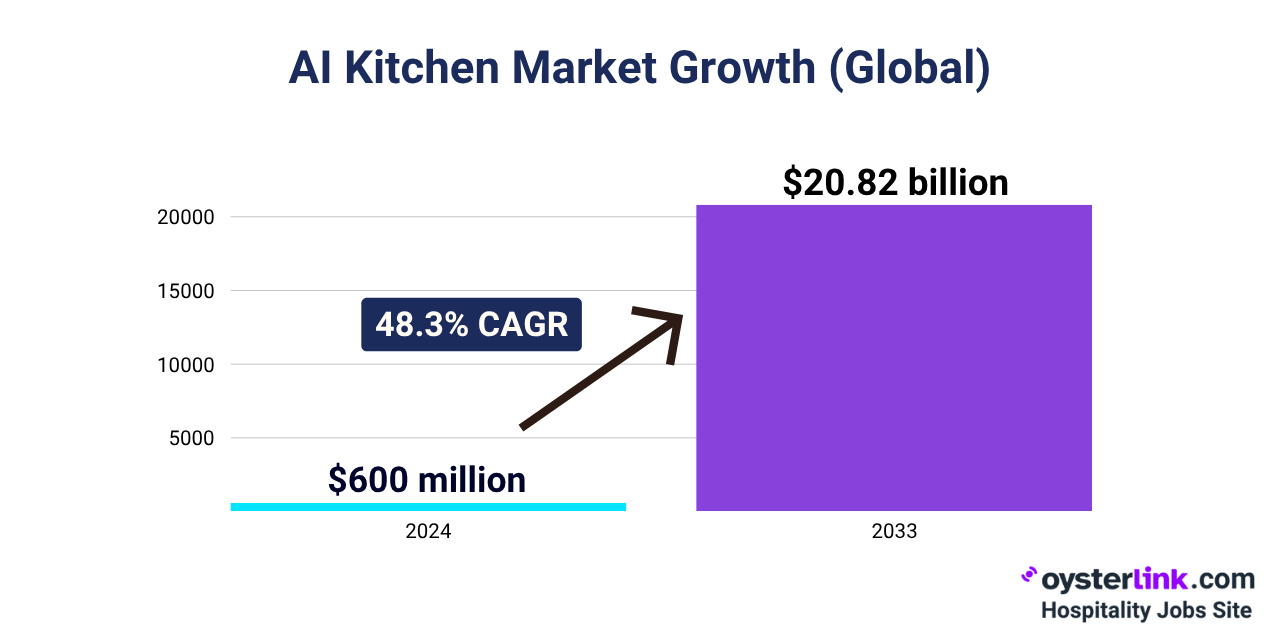
- AI kitchen market growth: The global AI kitchen market is expected to reach $20.82 billion by 2033, growing at a CAGR of 48.3%. (Source)
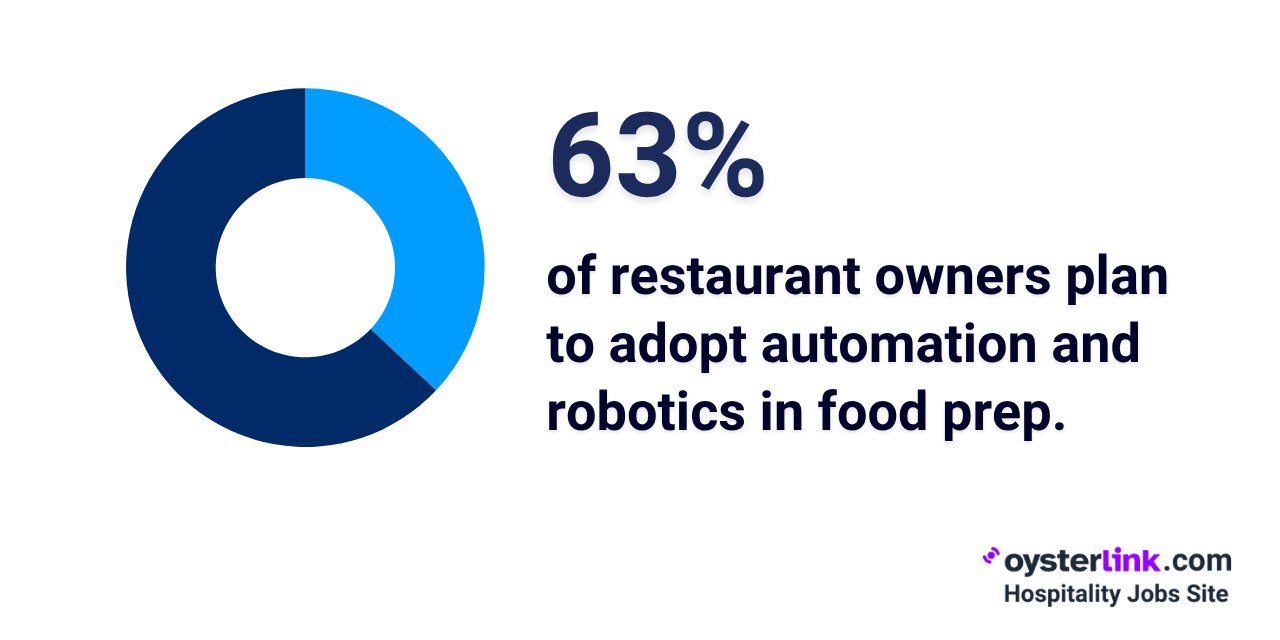
- Around 63% of restaurant owners (some of whom are also Chefs) reported planning to adopt automation and robotics for food preparation in their kitchens.
- In the U.S., there are currently 234 restaurants with a Michelin rating, with 14 of these holding the highest honor of three stars.
- New York City leads the country with 74 Michelin-starred restaurants: including five with three stars, 13 with two stars and 56 with one star.
- Around 67% of operators whose restaurants have hard-to-fill job openings say kitchen positions (which include Chefs) are the toughest to find applicants for.
See also: Top 10 Restaurant Industry Trends for 2025
Chef Statistics in the US: Final Notes
The 2025 Chef statistics highlight growing demand and new challenges in the profession.
Chef employment is up across restaurants, hotels, and specialty food services, though issues like salary satisfaction, turnover, and labor shortages persist.
Despite this, many Chefs feel strong alignment with their careers, driven by passion.
With automation, AI, and sustainability shaping operations and guest expectations, success now requires more than just technique, it demands adaptability, awareness, and leadership.

Loading comments...