Waiter/Waitress Demographics, Workforce Size & Statistics in the US – 2026
If you've ever wondered how many Waiters and Waitresses are currently working in the United States or how old they are — we answer all of those questions and much more in this article.
- Over 2.2 million servers, including both waiters and waitresses, are currently employed across the United States, reflecting the importance of the food service industry.
- Female waitresses significantly outnumber male waiters, with a gender ratio of 4:1 in this field.
- The average annual earnings for waiters and waitresses nationwide come in at $36,530, though this can vary by region and experience level.
- Approximately 67% of all servers work on a part-time basis, often balancing this role with other jobs or educational pursuits.
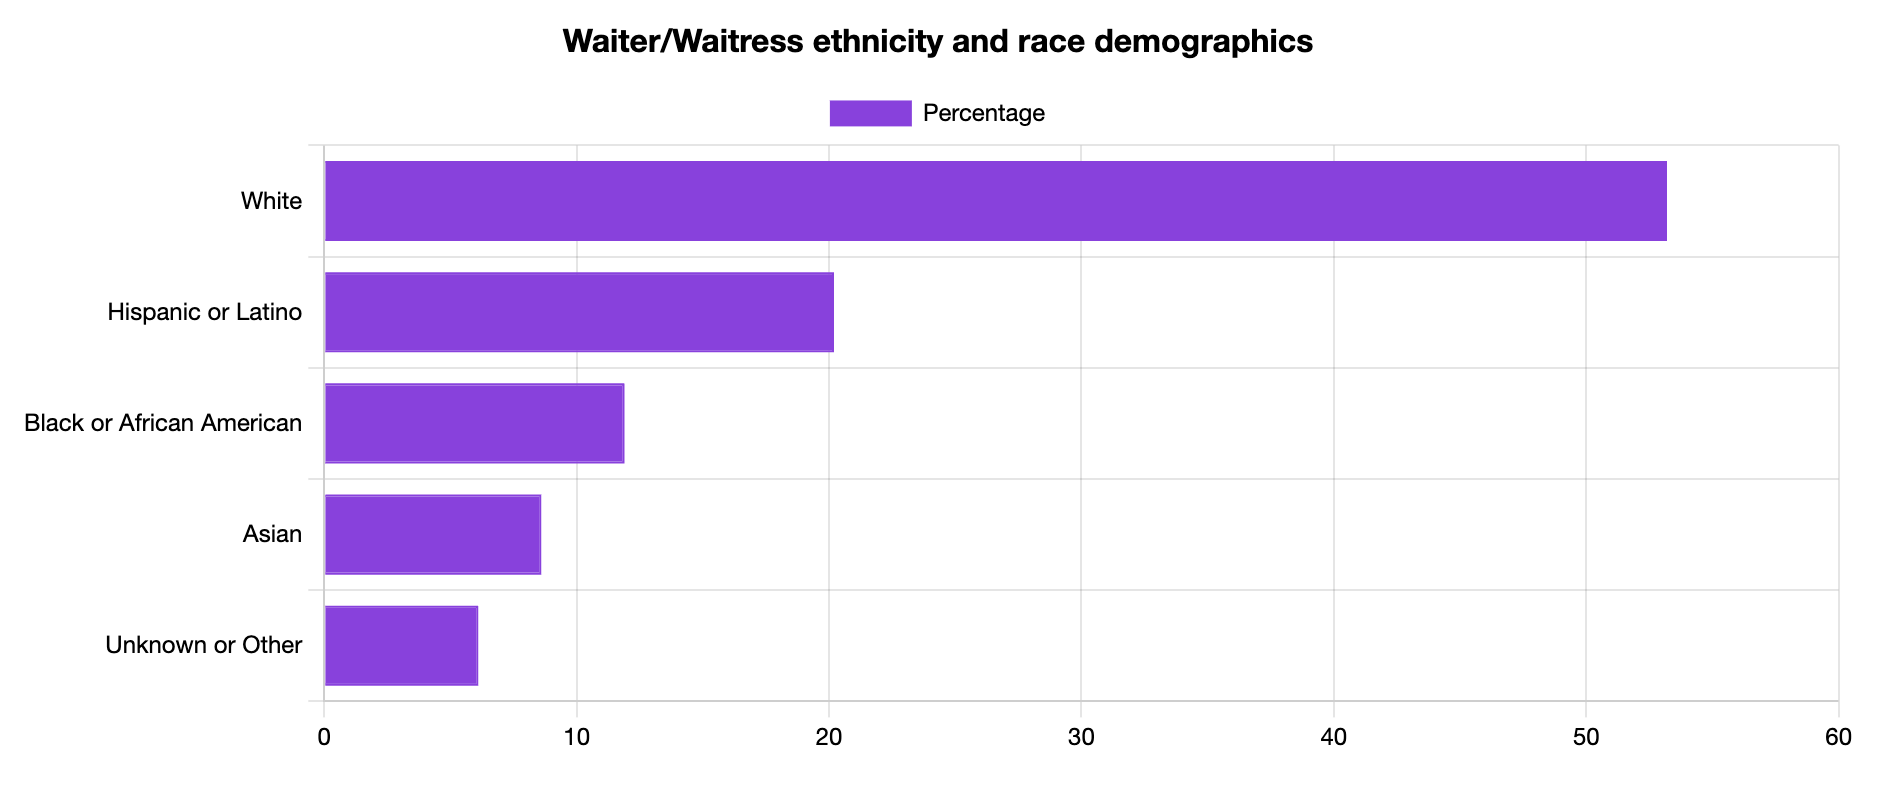
- More than 50% of servers, including waiters and waitresses, identify as white, while a significant portion of the workforce is also Hispanic or Latino.
Waiter/Waitress Employment Statistics
There are currently 2,237,850 people working as a Waiter or a Waitress in the U.S.
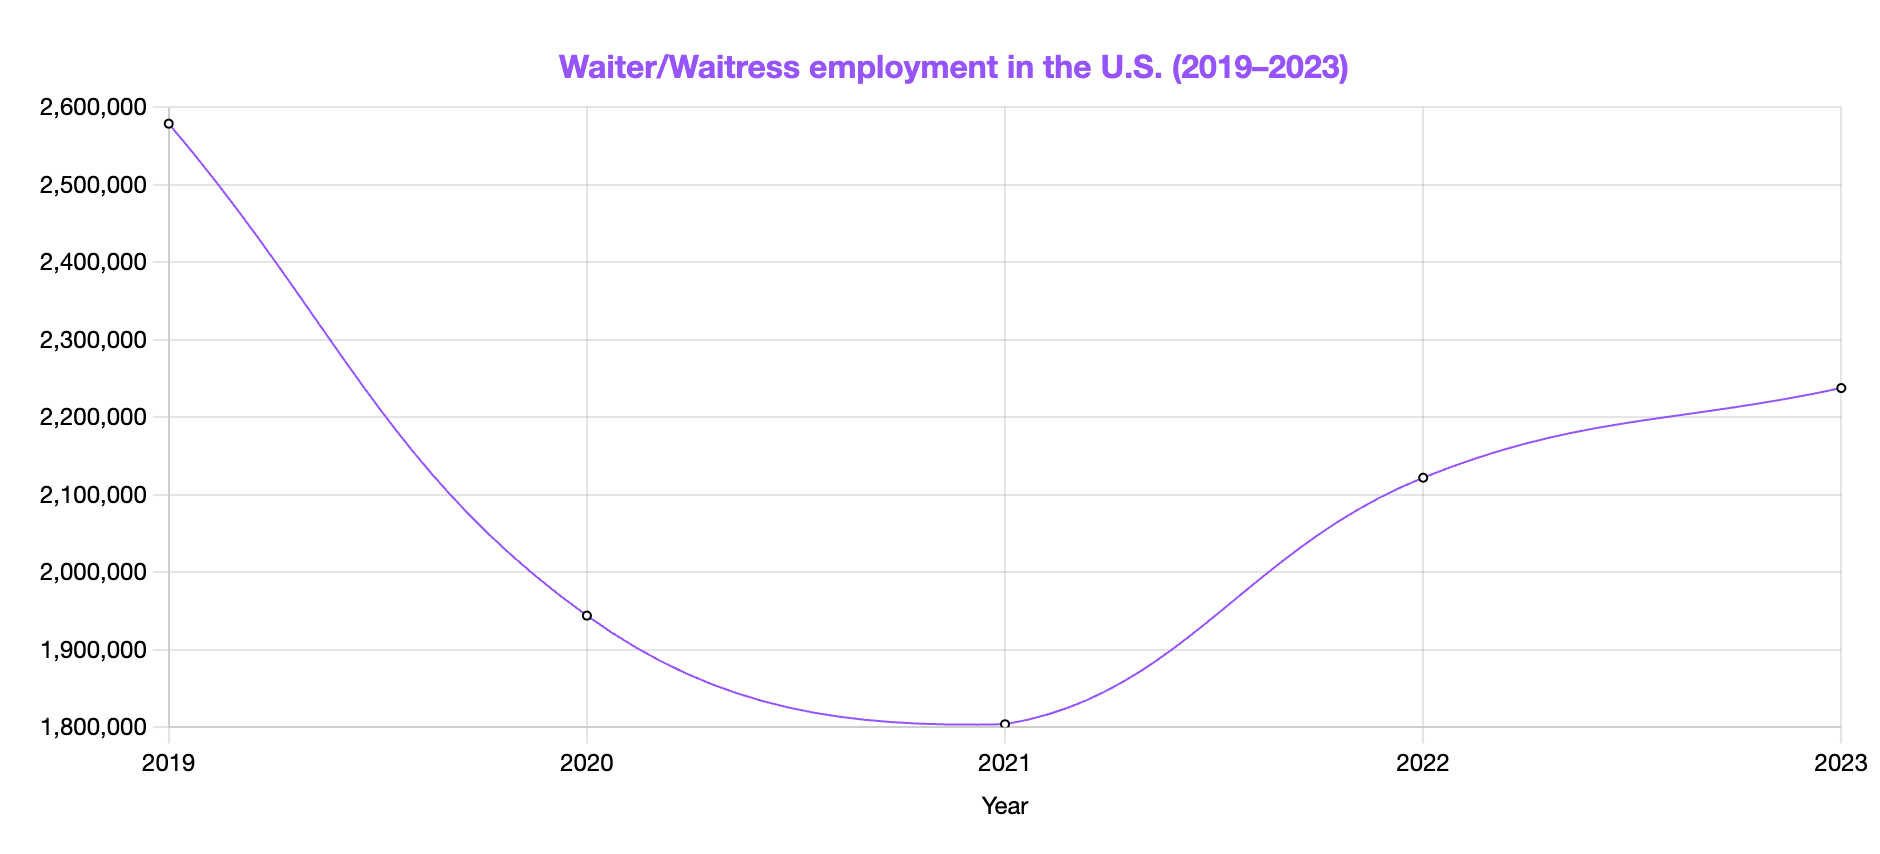
The graph above shows how demand for Waiters ground to a halt back in 2020 when restaurants and hotels had to shut down. Even though it's much better now, we're still nowhere close to 2019 employment levels.
Waiter/Waitress Gender Statistics
Perhaps unsurprisingly, a massive 80% of people working in this role are women, i.e. Waitresses. Just 20% of them are Waiters.
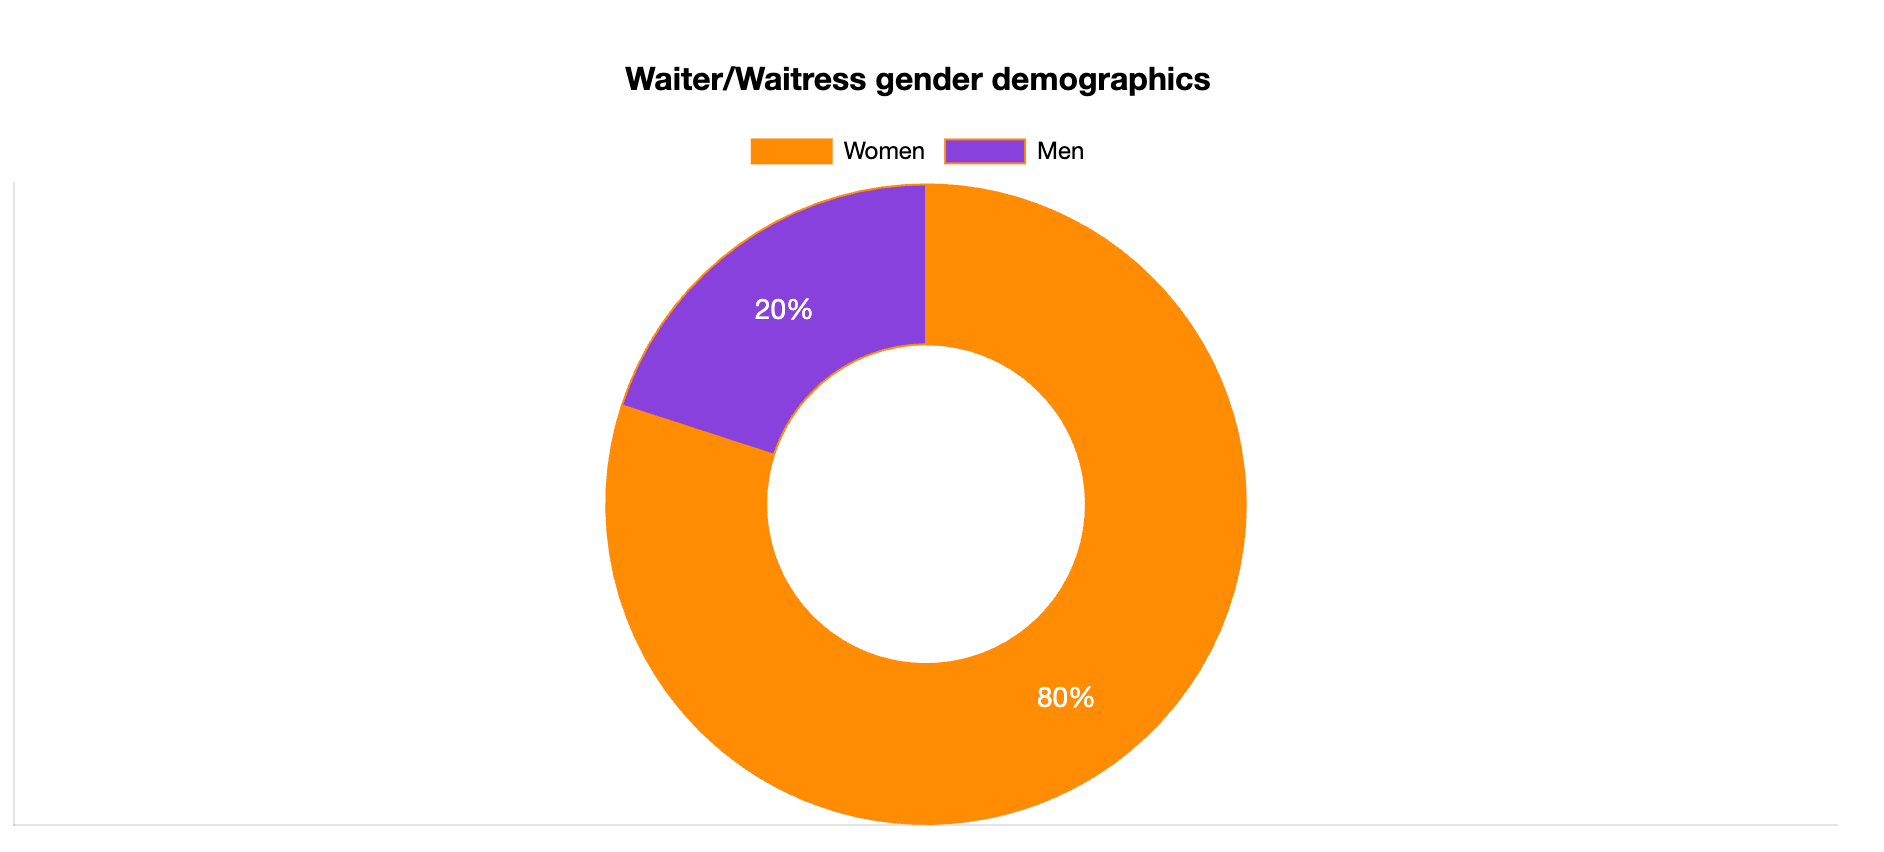
The data is similar to Fine Dining Server demographics where the majority of individuals working in the role are women.
Waiter/Waitress Age Statistics
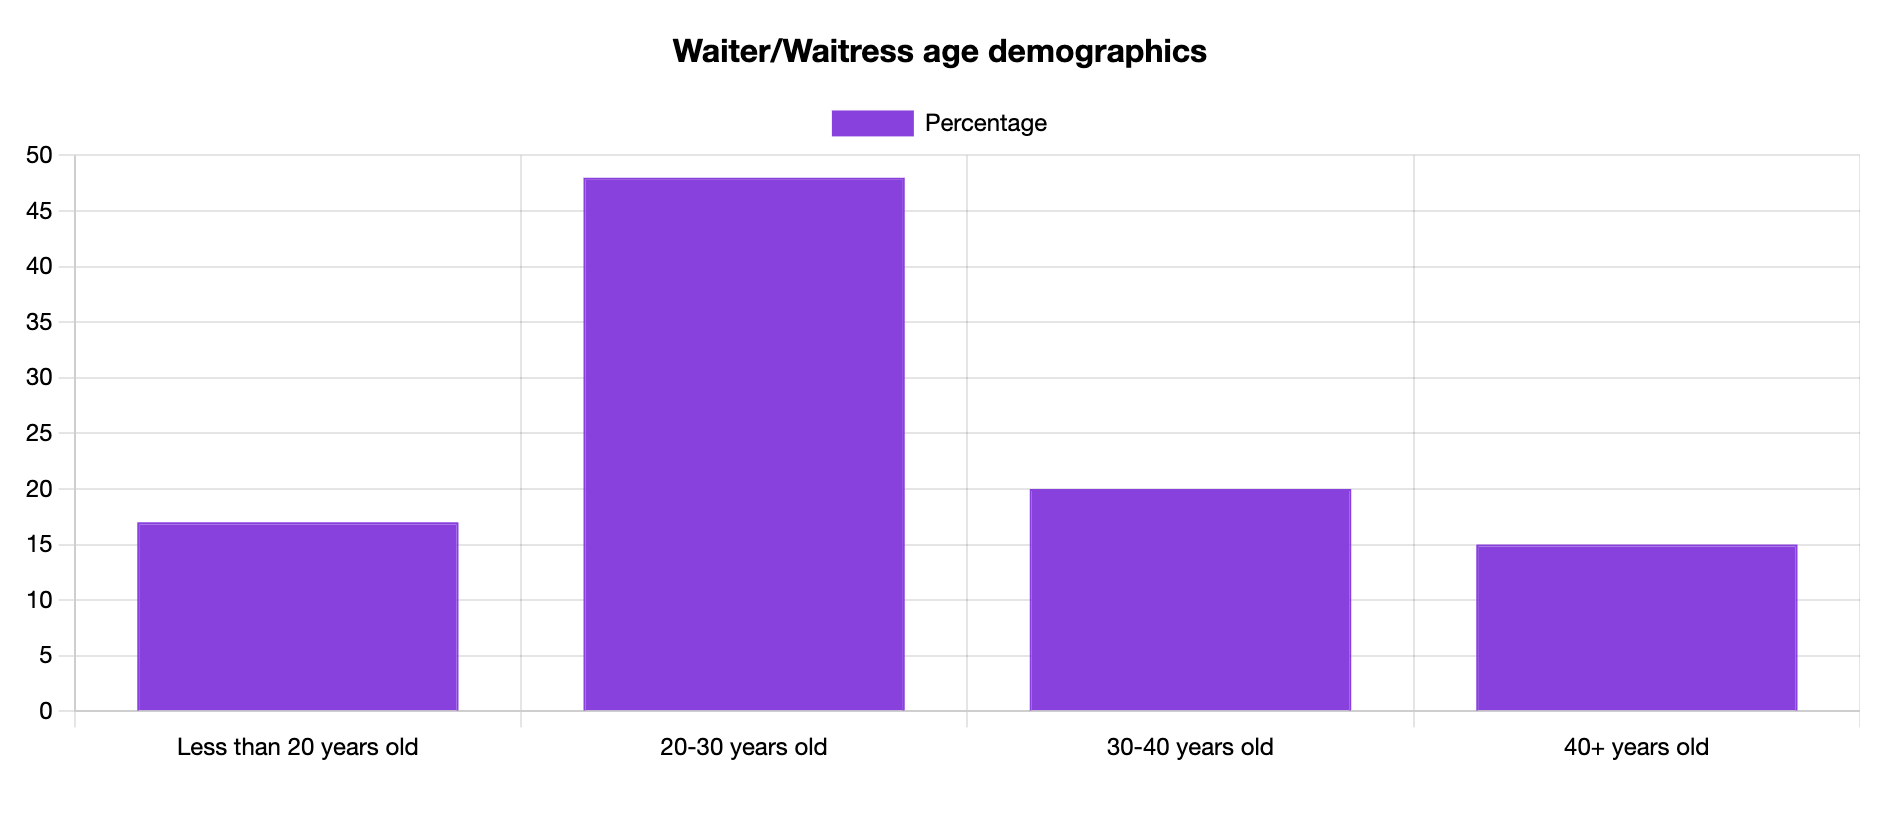
- A large majority of servers, particularly waitresses and waiters, are under 40 years of age, with younger workers dominating the workforce.
- Only 15% of the server workforce consists of individuals over the age of 40, highlighting the role's appeal to younger demographics.
- Restaurants and dining establishments employ the bulk of servers, including waiters and waitresses, across various regions in the country.
- The server role is typically seasonal, with increased demand for waiters and waitresses during the busy summer months and holiday periods.
- A high school diploma is the minimum educational requirement for most waiter and waitress positions, though higher education can open doors to supervisory roles.
Waiter/Waitress Employment Type Statistics
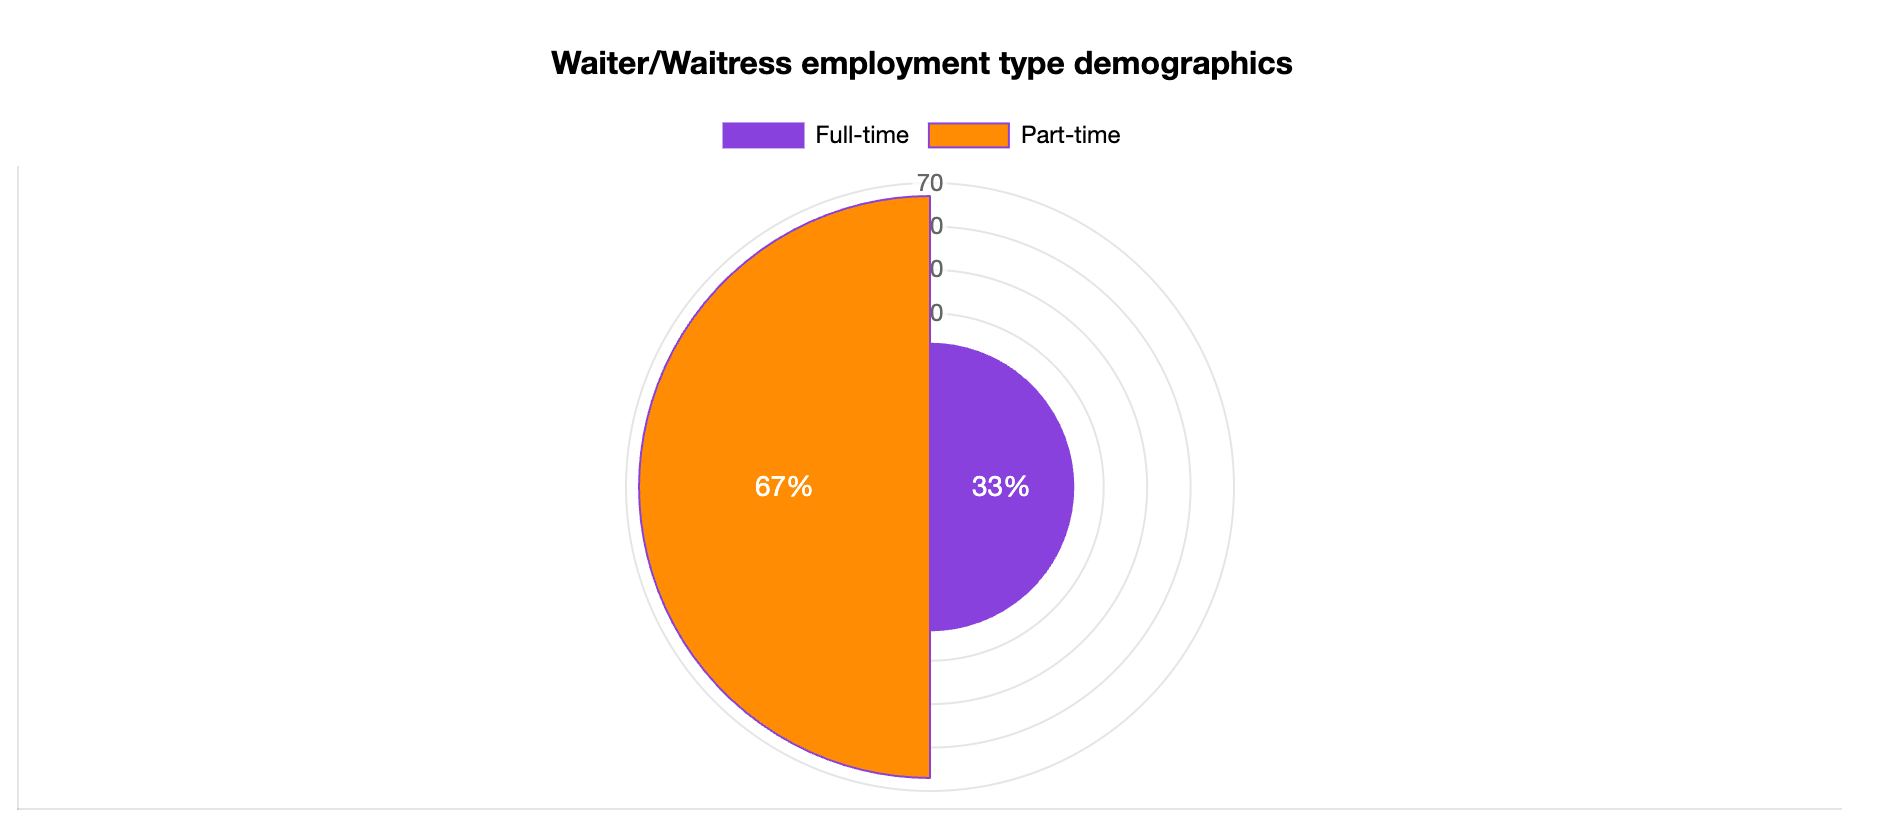
This is a mostly seasonal job since demand for Waiters and Waitresses is significantly higher during summer and over the holidays than it is during winter.
On top of that, many young people work as a Waiter/Waitress to earn some money they can spend once their studies start back up again in the fall, so it comes as no shock that 67% of Waiters/Waitresses work part-time. Just 33% are employed full-time.
By contrast, 52% of Bartenders are employed full-time, but that position requires applicants to be older in order to be able to serve alcohol and it also pays slightly better.
Waiter/Waitress Ethnicity and Race Statistics
- Approximately 39% of waiters and waitresses exit their jobs within a year, making it a role with high turnover, especially among younger workers.
- Bilingual servers, including waiters and waitresses, often have an advantage in landing jobs in diverse or multilingual communities.
- Around 67% of wait staff, whether waiters or waitresses, prefer to work part-time, allowing flexibility for other activities like school or family responsibilities.
- Full-time employment is more common among bartenders, with 52% working full schedules compared to their part-time counterparts in the server industry.
- More than half of all U.S. servers, especially waiters and waitresses, are white, although the industry also includes a sizable Hispanic workforce.
Waiter/Waitress Education Statistics
36% of all Waiters/Waitresses only have a high school diploma, which is backed up by the fact that most Waiter/Waitress jobs in the U.S. only require a high school diploma from the applicant.
Still, a rather impressive 33% of all employees in this role have a bachelor's degree and a further 18% have an associate degree.
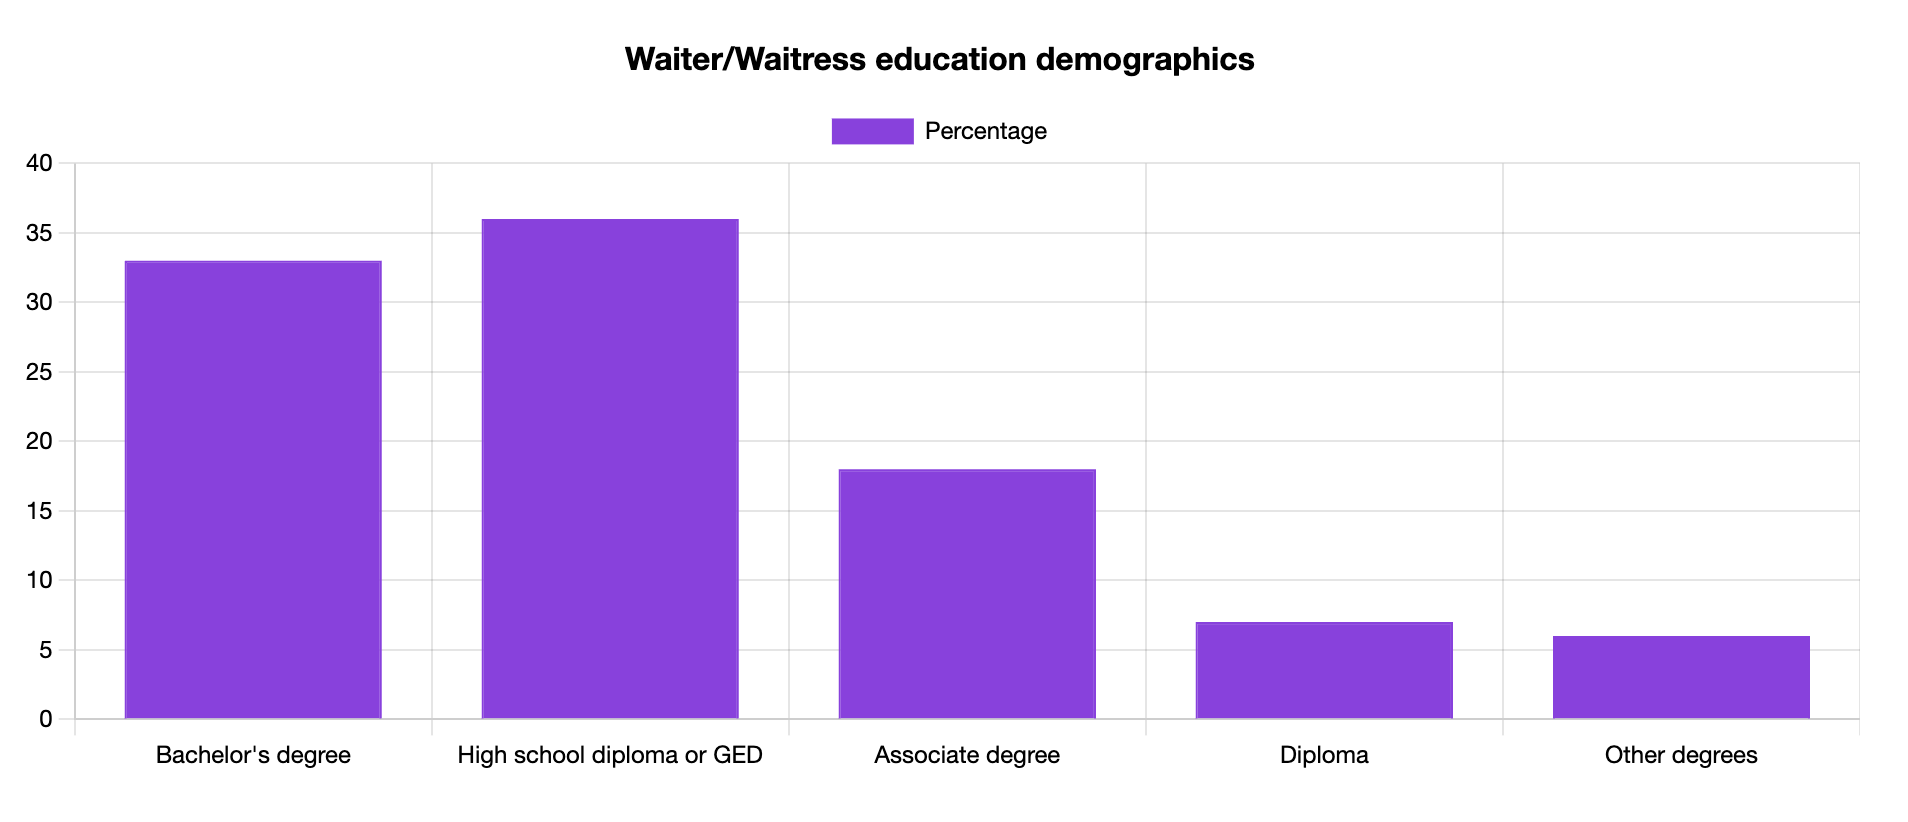
The above data is similar to Server demographics, where 40% of them have a bachelor's degree.
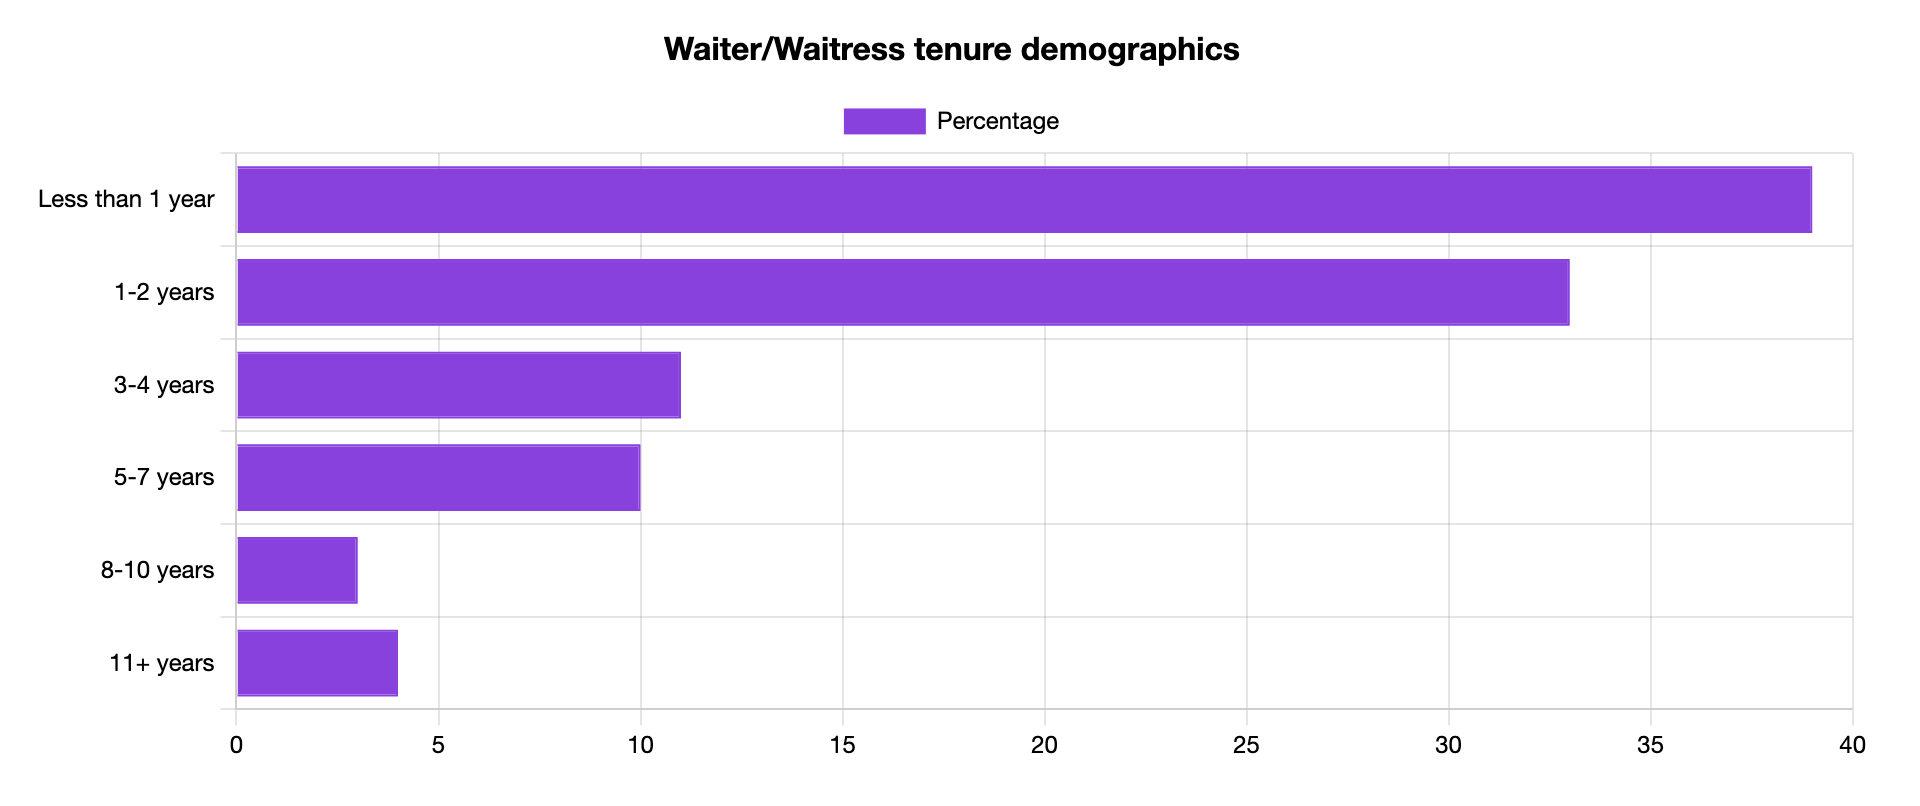
Waiter/Waitress Tenure Statistics
Tenure indicates how long Waiters and Waitresses remain in this role before moving to a different position or switching careers.
39% of Waiters/Waitresses remain in this position for less than a year before moving on to different jobs. 33% remain between one and two years and just 4% stay in this position for 11 years or more, making it their life-long career.
Waiter/Waitress Industry Statistics
Restaurants and other dining places employ the most Waiters/Waitresses with 1,830,190 employees. Traveler accommodation, such as hotels, is second, with 127,390 Waiters and Waitresses.
This is followed by other amusement and recreation industries, special food services and drinking places.
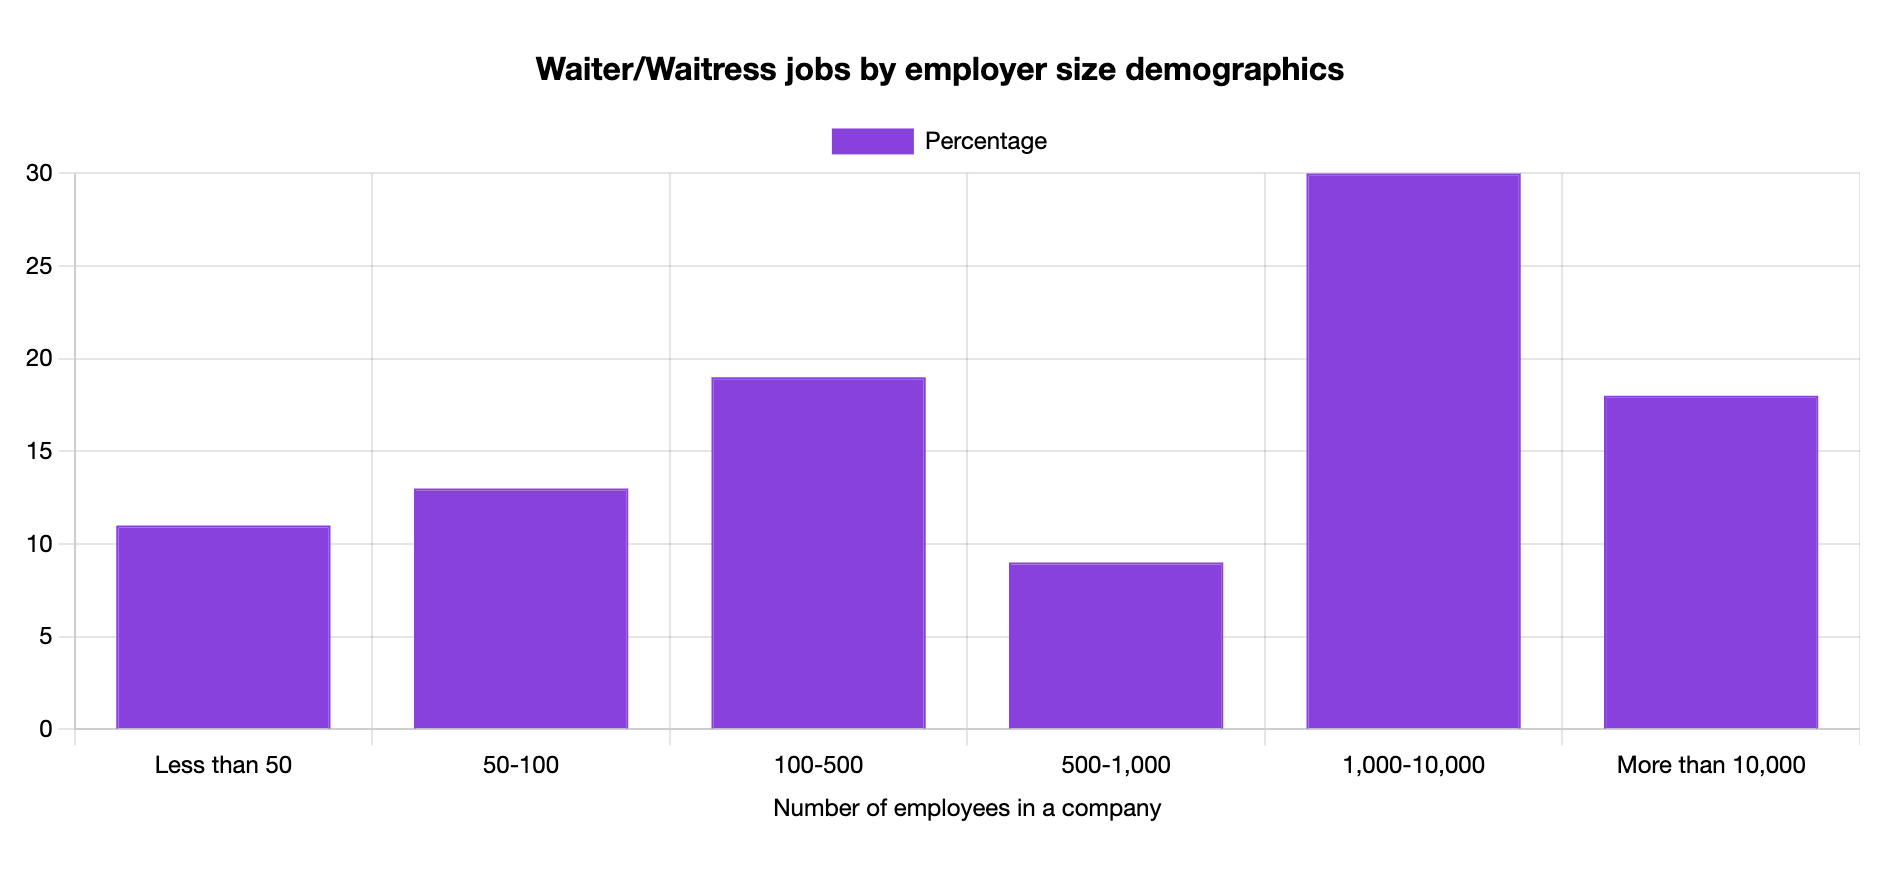
Waiter/Waitress Jobs by Company Size Statistics
Most Waiters/Waitresses work in large hotels and restaurants.
30% of them are employed in companies that have between 1,000 and 10,000 employees. Just 11% of Waiters and Waitresses work in small, family-owned companies that have less than 50 total employees.
You can view the full breakdown in this graph.
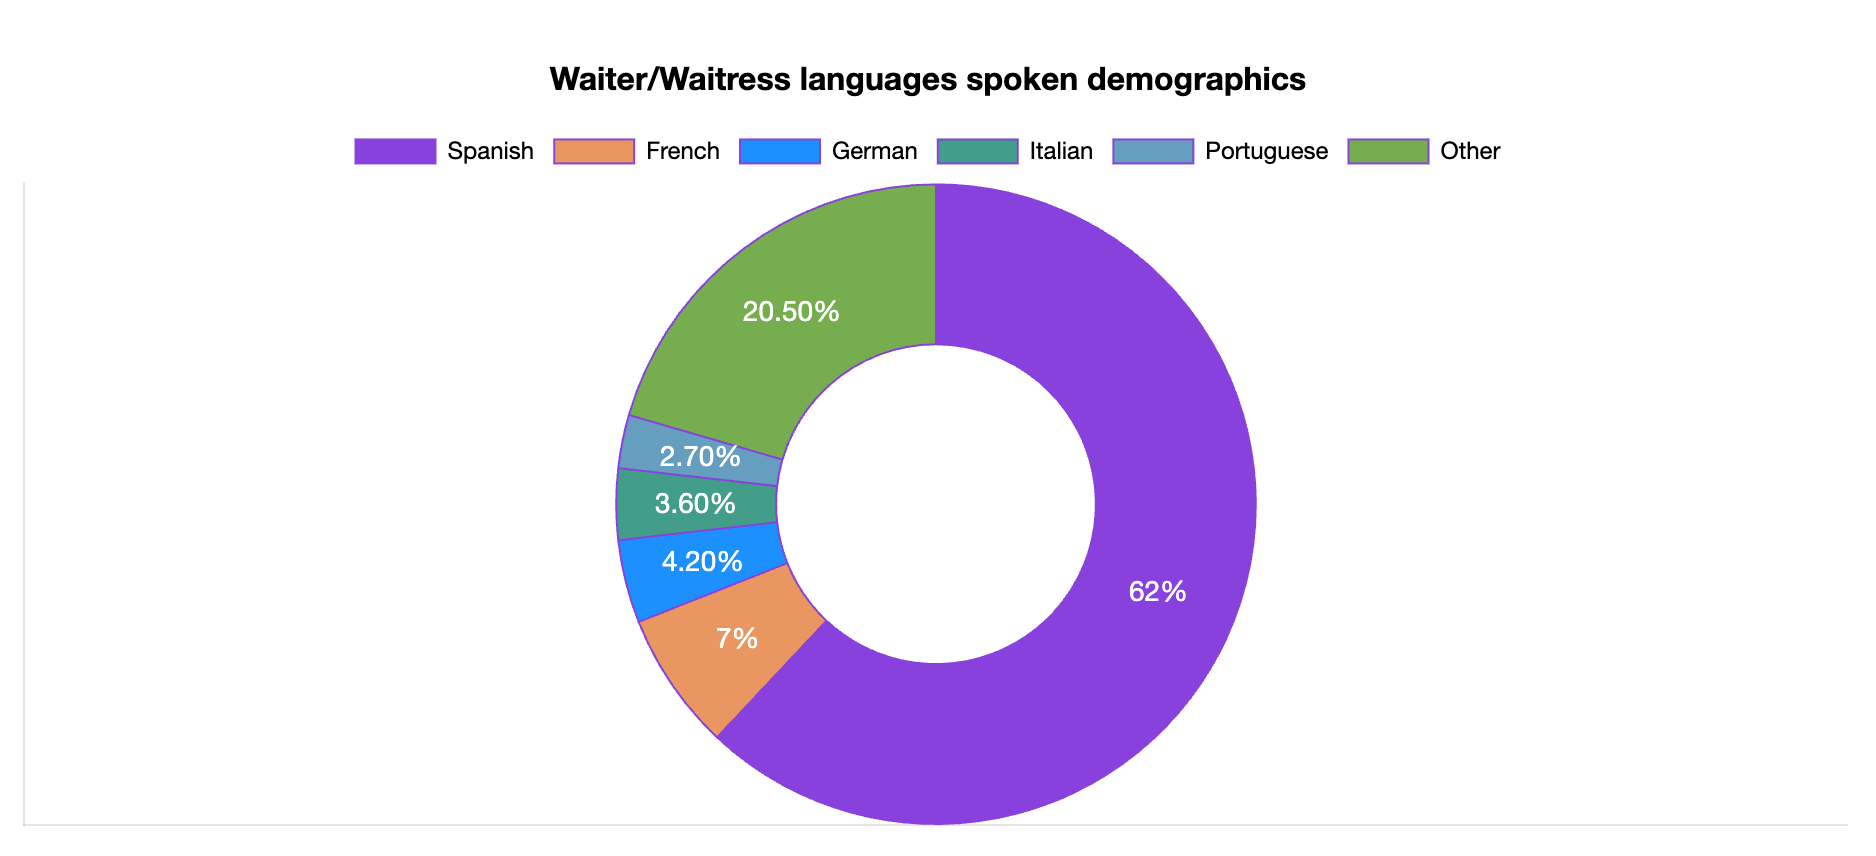
Waiter/Waitress Languages Spoken
Leaving English aside, 62% of Waiters/Waitresses who speak a second language speak Spanish, and just 7% can speak French. German, Italian and Portuguese are second, third and fourth, respectively, but all other languages not mentioned here account for another 20.5%.
Most establishments have simple Waiter/Waitress requirements in their job descriptions, but speaking an additional language can definitely help you land a job. We even have Waiter/Waitress resume templates if you're thinking about applying soon.
Waiter/Waitress Statistics and Demographics Data
We collect data from several sources, including federal and state websites and agencies. To view how exactly we gather and calculate data, check out our methodology page.

Reviewed by Stefan Petrov
With over 10 years of experience as a writer and editor, Stefan has worked in the automotive, IT, health and hospitality industries. Familiar with Google Search Console and other SEO tools like Ahrefs and Semrush, Stefan uses his experience to create content that's visually appealing to the user but also ranks in the SERPs.