
Using data from the Bureau of Labor Statistics (BLS) and other government websites, we’ve gathered and created unique unemployment statistics for the United States.
Here are some short and direct statistics before we take a look at some detailed graphs and charts:
- The current unemployment rate (January 2025) in the United States is 4.1%
- There are over 7.1 million people currently unemployed in the U.S.
- Over 5.6 million people are currently actively looking for a job
- 21.6% of those currently unemployed have been without a job for over 27 weeks (6 months)
- Compared to 2014, the current unemployment rate for men and women is down 1.7% and 1.8% respectively
*Note: All of our graphs are interactive. Hover over them to learn more. Additionally, for graphs that feature multiple lines or bars, you can toggle them on or off by clicking the button at the top of graph (veteran/nonveteran, bachelor’s/associate’s degree, etc.)
Unemployment Rate in the US
In the graph below, you can see how the unemployment rate in the U.S. fluctuated between 2014 and 2024.
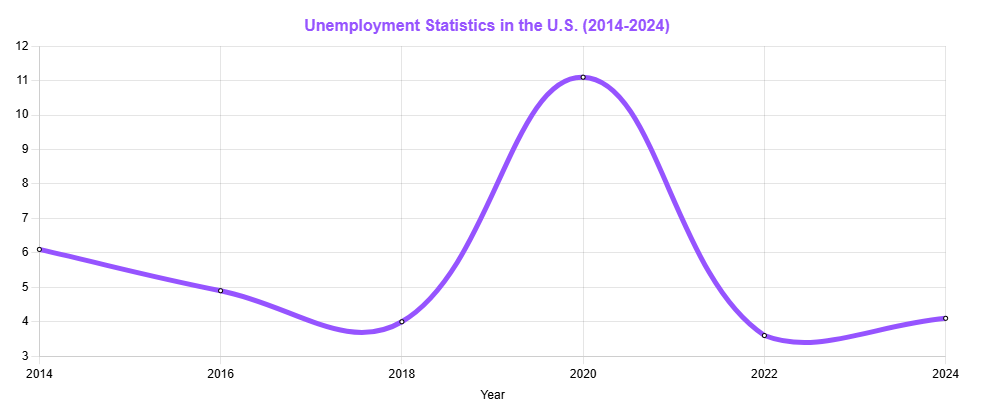
In the last decade, the unemployment rate in the United States went up and down because of policy changes and global events.
The large spike in 2020 is due to the global pandemic, during which most of the world experienced higher unemployment rates, not just the U.S.
The Number of Unemployed People Looking for a Job
There are many people not in the labor force (unemployed) who have expressed a desire to work should the right opportunity arise.
Here’s how the number of these individuals changed over the last decade:
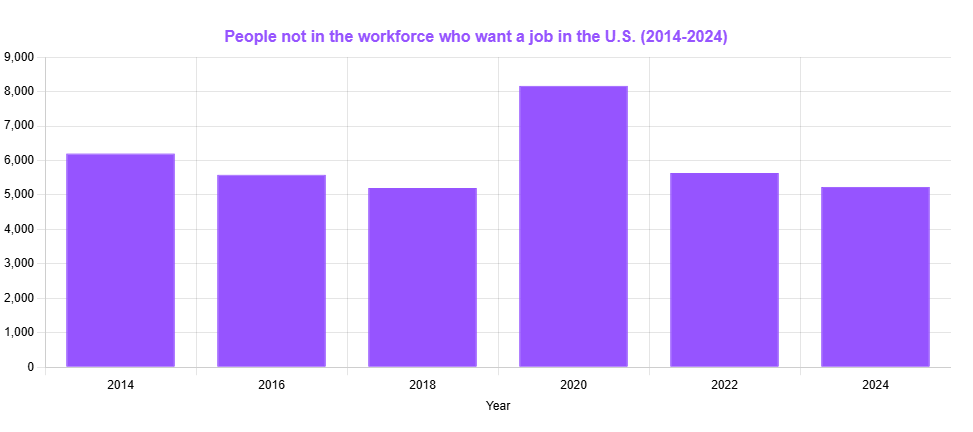
As you can tell by that massive spike, we went from “only” 5.2 million people looking for a job in 2018, to over 8.1 million people looking for a job in 2020. Thankfully, it’s now come back down to pre-pandemic levels.
Unemployment Rate by Ethnicity and Race
Below you will find the unemployment rate segmented by race and ethnicity.
Use it to see how unemployment during the past 10 years affected different racial groups and ethnicities.
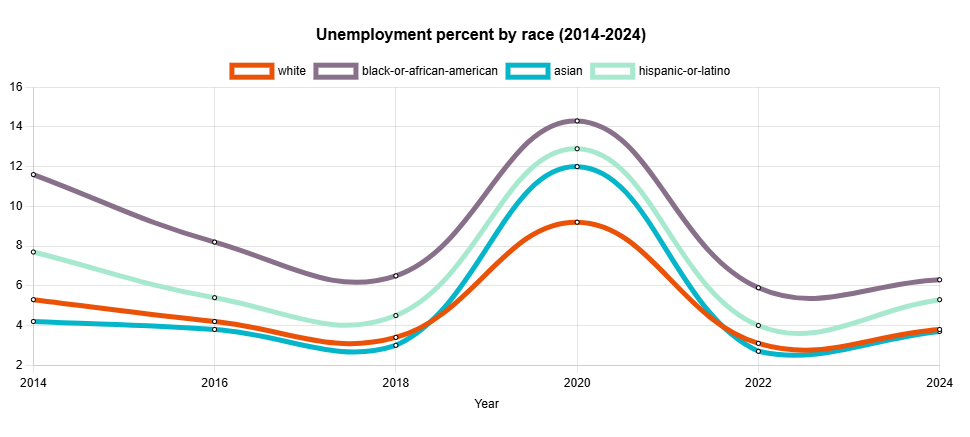
African Americans were most affected by the pandemic, followed by Hispanics and Latinos, Asians and finally white people.
The 2024 unemployment rate for Black or African Americans was 6.3%. Meanwhile, it was 5.3% for Hispanics and almost identical for Asians and whites (3.7% and 3.8% respectively).
Unemployment Rate by Gender
This section provides an overview of the unemployment rate over the past decade for men and women over 20 years old.
The combined graph shows how unemployment rates differed between genders over time.
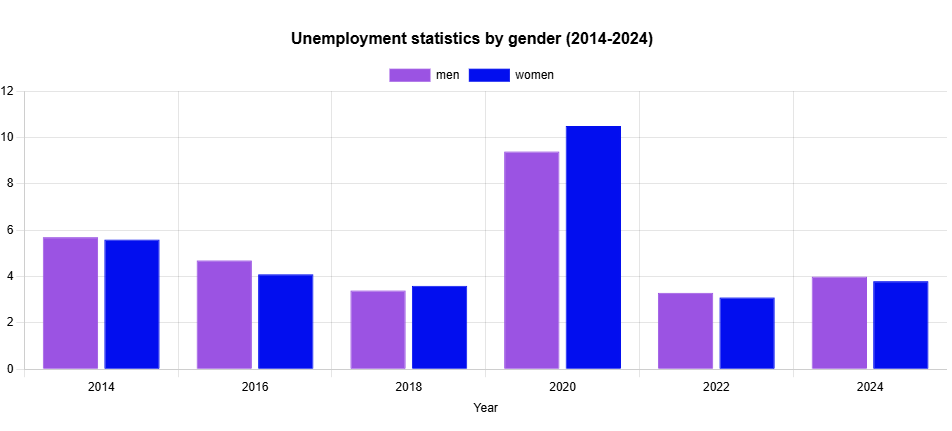
Interestingly enough, the unemployment rate for women was 0.6% lower compared to men back in 2016. In 2020, during the pandemic, women actually experienced a 1.1% greater unemployment rate.
By 2025, that figure has now stabilized and there’s only a 0.2% difference in the unemployment rate between men and women.
Unemployment Rate by Education Level
Educational attainment significantly impacts job stability and security.
The graph below illustrates how education level affected unemployment levels over the past decade.
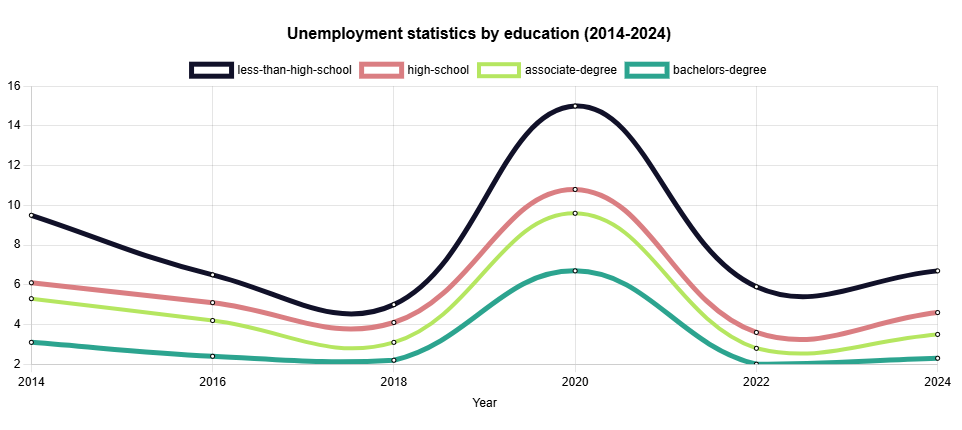
As you can see, during the 2020 pandemic, the unemployment rate for those with a bachelor’s degree only rose to 6.7%, whereas it went up to 15% for those with only a high school diploma.
As for people who have been unemployed for over 27 weeks (6 months), we went down from 3.1 million people in 2014 to 1.5 million in 2025.
Unemployment Level by Veteran Status
In this section you can see the unemployment rates between veterans and non-veterans.
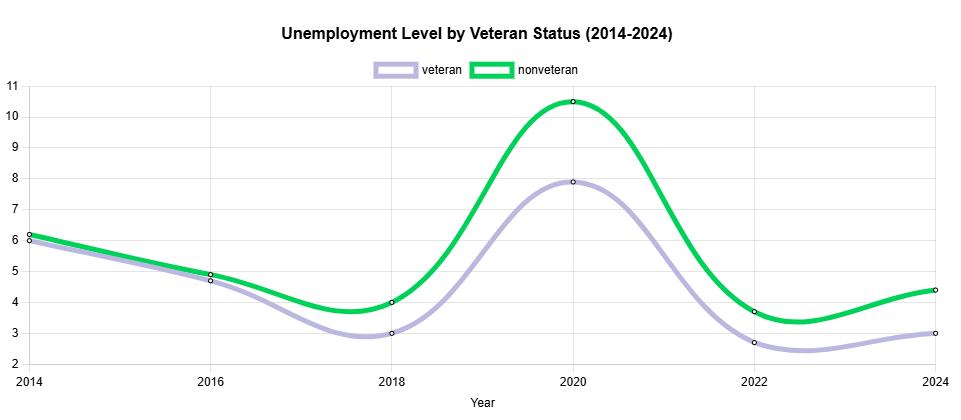
Additionally, you can see the unemployment rates for veteran men and veteran women in the below graph.
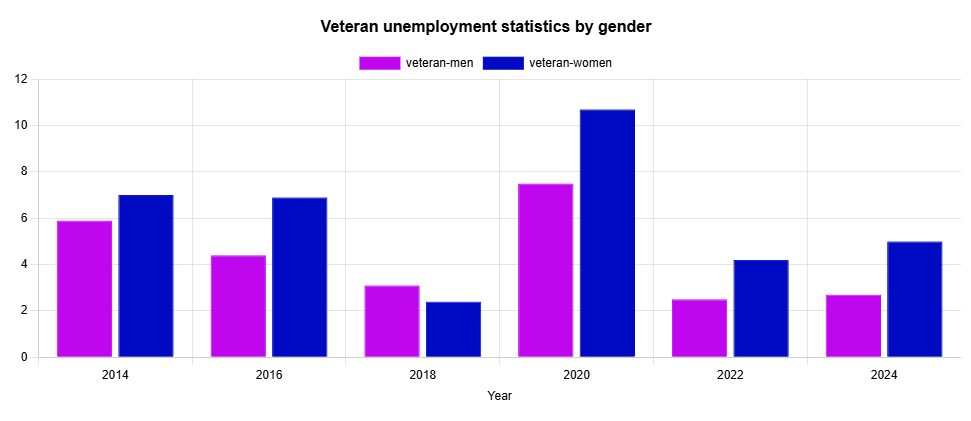
Veterans who happened to be female saw a significant rise in the unemployment rate in 2020, up to 10.7%. During that same period, the unemployment rate for veteran men was at a much lower 7.5%.
Unemployment Statistics by the Duration of Unemployment
This section examines how long unemployed individuals have been without a job.
The graph below is broken into categories based on the duration of unemployment.
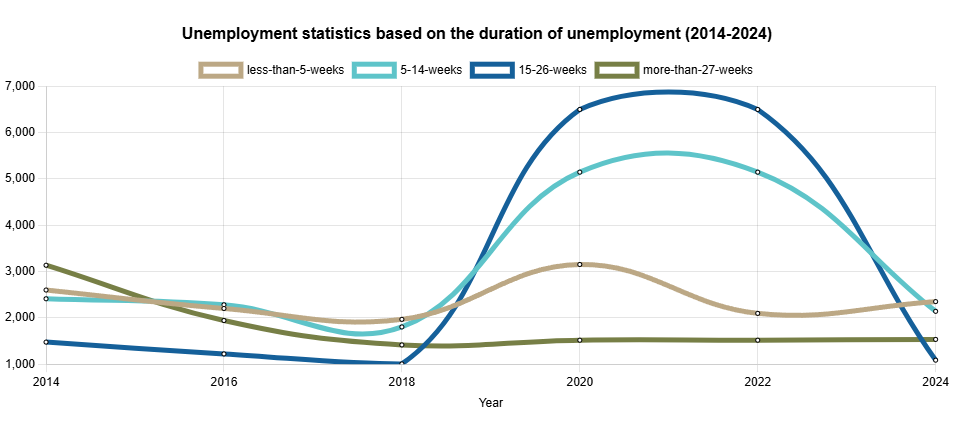
As you can see, during 2019 to 2022, most people, over 6.5 million of them, went on without a job for an average of 15 to 26 weeks, i.e. roughly 4 to 6 months.
The number of people who remained without a job throughout most of the decade remained relatively consistent at around 1.5 million.
Unemployment Statistics by Reasons for Unemployment
Understanding why people are unemployed is crucial for addressing the root causes of joblessness.
This section categorizes unemployment reasons, providing a detailed look at factors contributing to unemployment.
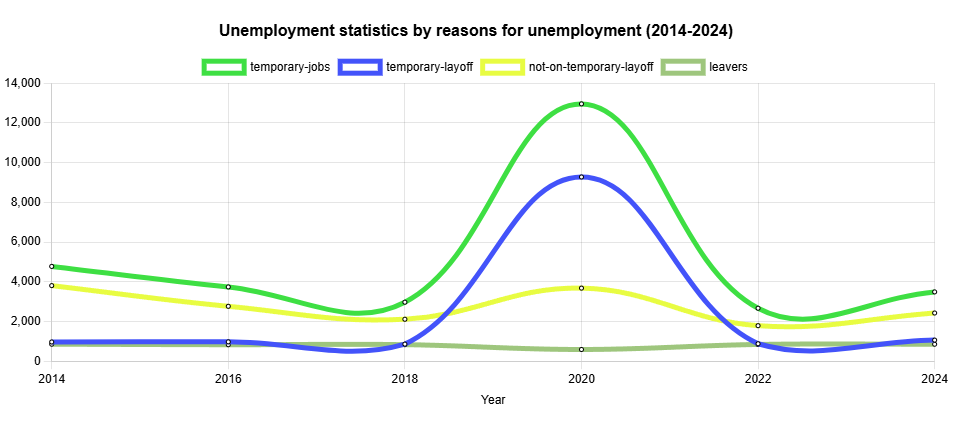
Unfortunately, the majority of those who lost their jobs during the pandemic were either only working part-time jobs and hence why they got laid off (12.9 million), or they were temporarily laid off due to mandatory shutdowns or similar factors (9.2 million).
6 More Unemployment Statistics
- South Dakota has the lowest unemployment rate at just 2%
- The District of Columbia has the highest unemployment rate at 5.5%, followed by Nevada at 5.4%
- Of individual cities, Miami has the lowest unemployment rate at 1.8%
- Detroit has the highest unemployment rate for individual cities at 7.6%
- New York City, known as the Big Apple, has an unemployment rate of 4%
- Black or African Americans were most affected during the pandemic, with an unemployment rate that rose to 14.3%
Unemployment Rate Formula
According to the Bureau of Labor Statistics, the unemployment rate is the percentage of unemployed individuals from the total population of the U.S. who can work.
Knowing the unemployment rate of a country is important for the following reasons:
- It is one of the key metrics to assess the financial health of the economy
- Policy makers use it to make informed decision about monetary and fiscal policies
- It impacts consumer spending and confidence; when the unemployment rate is high consumers are less likely to spend money
You can calculate the unemployment rate using the below formula:
Unemployment Rate = (The number of unemployed people / the sum of both unemployed and employed individuals in the labor force) x 100%
So, in this example, if there are seven million unemployed individuals in a labor force of 160 million, you would calculate the unemployment rate in the following way:
Unemployment rate = (7,000,000 / 160,000,000) x 100
Unemployment rate = 0.04375 x 100
Unemployment rate = 4.375%
Natural Rate of Unemployment
The natural rate of unemployment refers to the minimum rate of unemployment that results from real and voluntary economic forces. This simply means that the rate of unemployment is caused by natural factors.
It reflects the number of people who are unemployed as they are moving to a new job, are replaced by technology or when the skills of the workforce don’t match the employers’ requirements.
By contrast, if unemployment is caused by institutional or policy-based factors, then it is not considered natural.
How We Calculate Unemployment Statistics
When creating our statistic pages, we focus on using government sources and websites such as the Bureau of Labor Statistics and the Census Bureau.
See how we do it on our statistics and demographics methodology page.


Loading comments...