20 Must-Know Statistics About Receptionists – 2026
This is your chance to explore the career cycle of a Receptionist and learn more about their average age, ethnicity, education and tenure (among other things).
- Only 10% of Receptionist make $47,361 per year
- On average, those employed in this role make a little over $17 per hour
- Receptionists with bachelor’s degrees earn $580 more per year than those with master’s degrees
- 47% of the Receptionist workforce is hired in the education sector
- The current unemployment rate for Receptionists is at 6.3%
Receptionist Employment Statistics
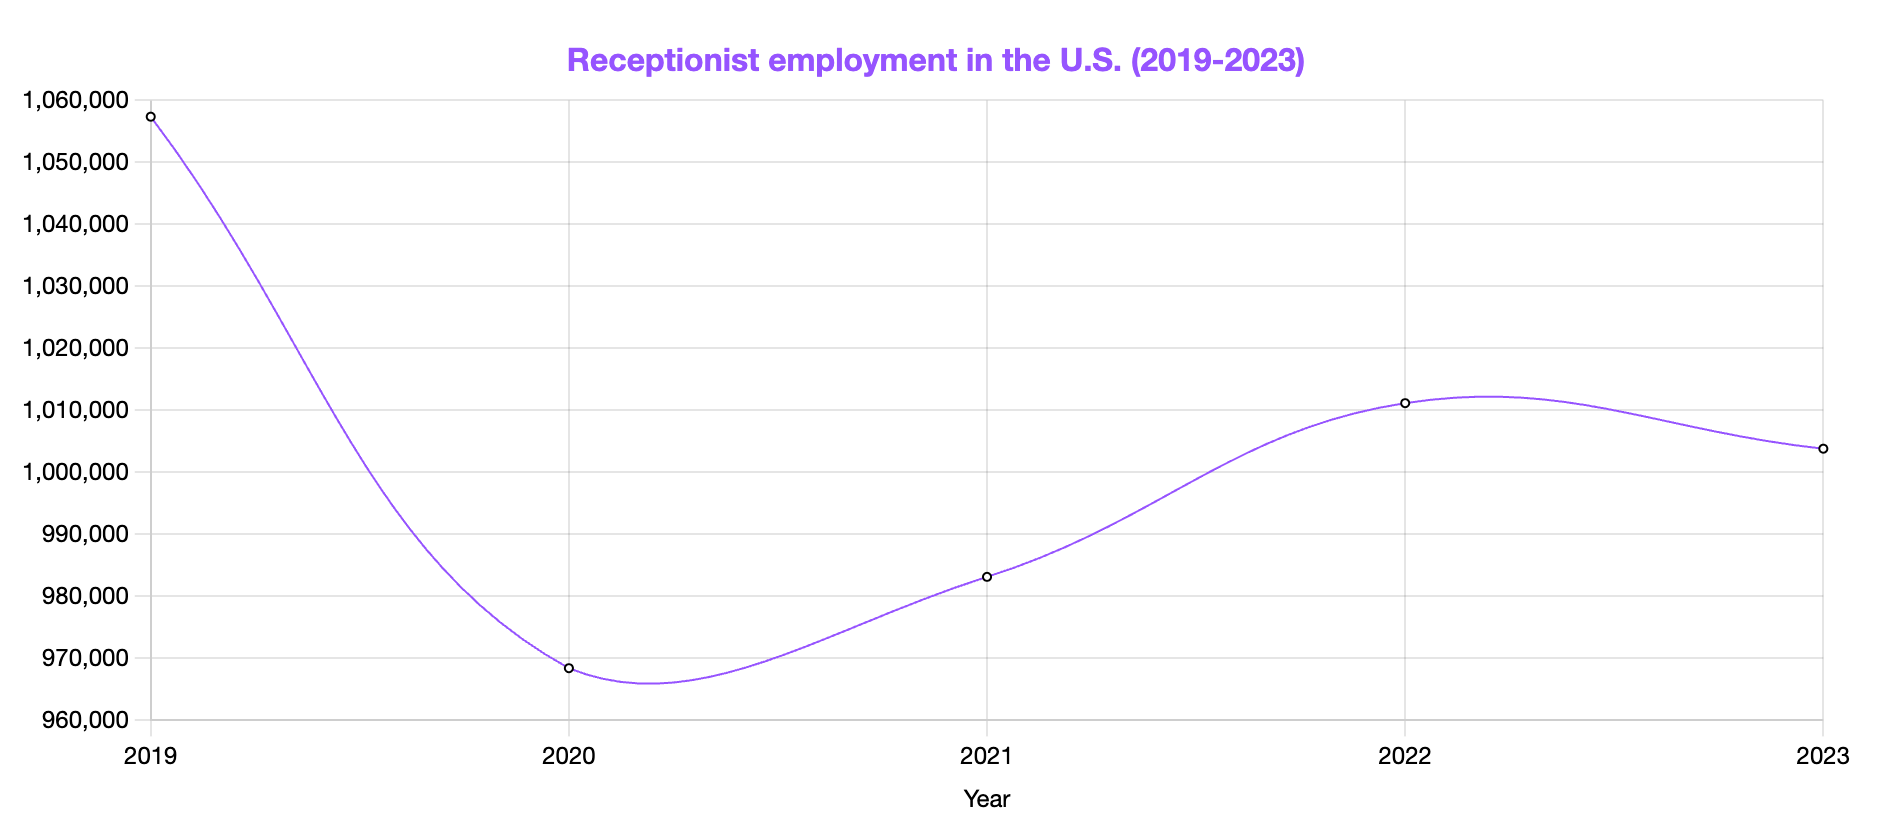
Although the number of Receptionists has grown since 2020, it hasn’t yet returned to pre-pandemic levels.
Receptionist Gender Statistics
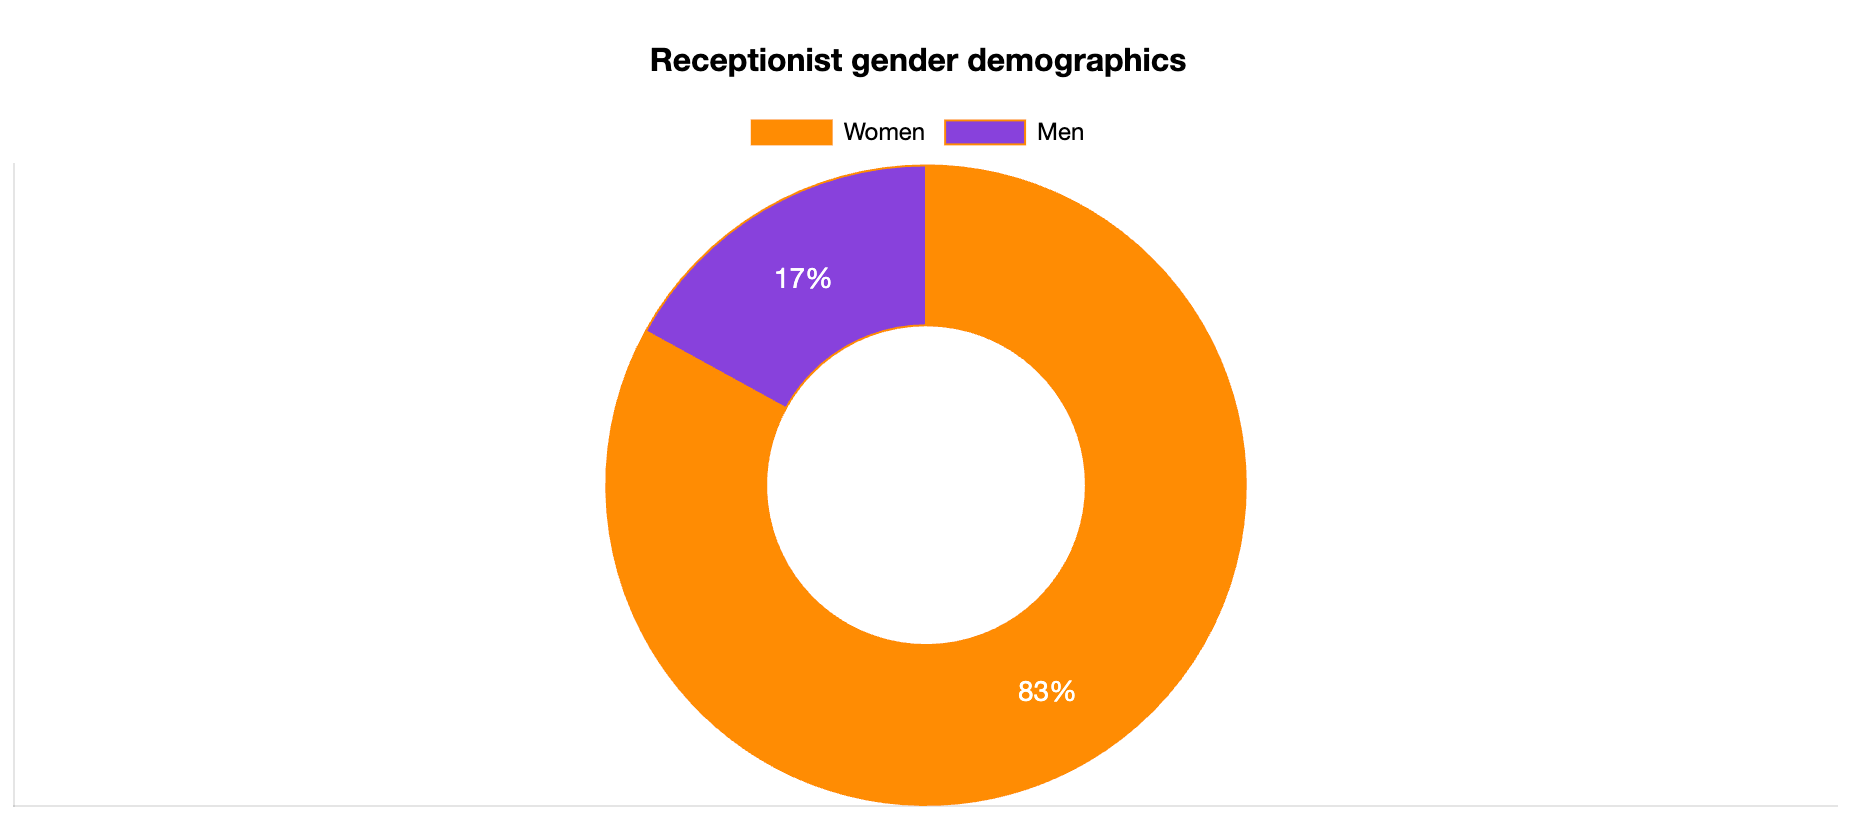
83% of Receptionists are women and 17% are men.
The hospitality industry has numerous female dominated roles such as that of a Receptionist and Concierge. Learn more on the Concierge demographics page.
Receptionist Age Statistics
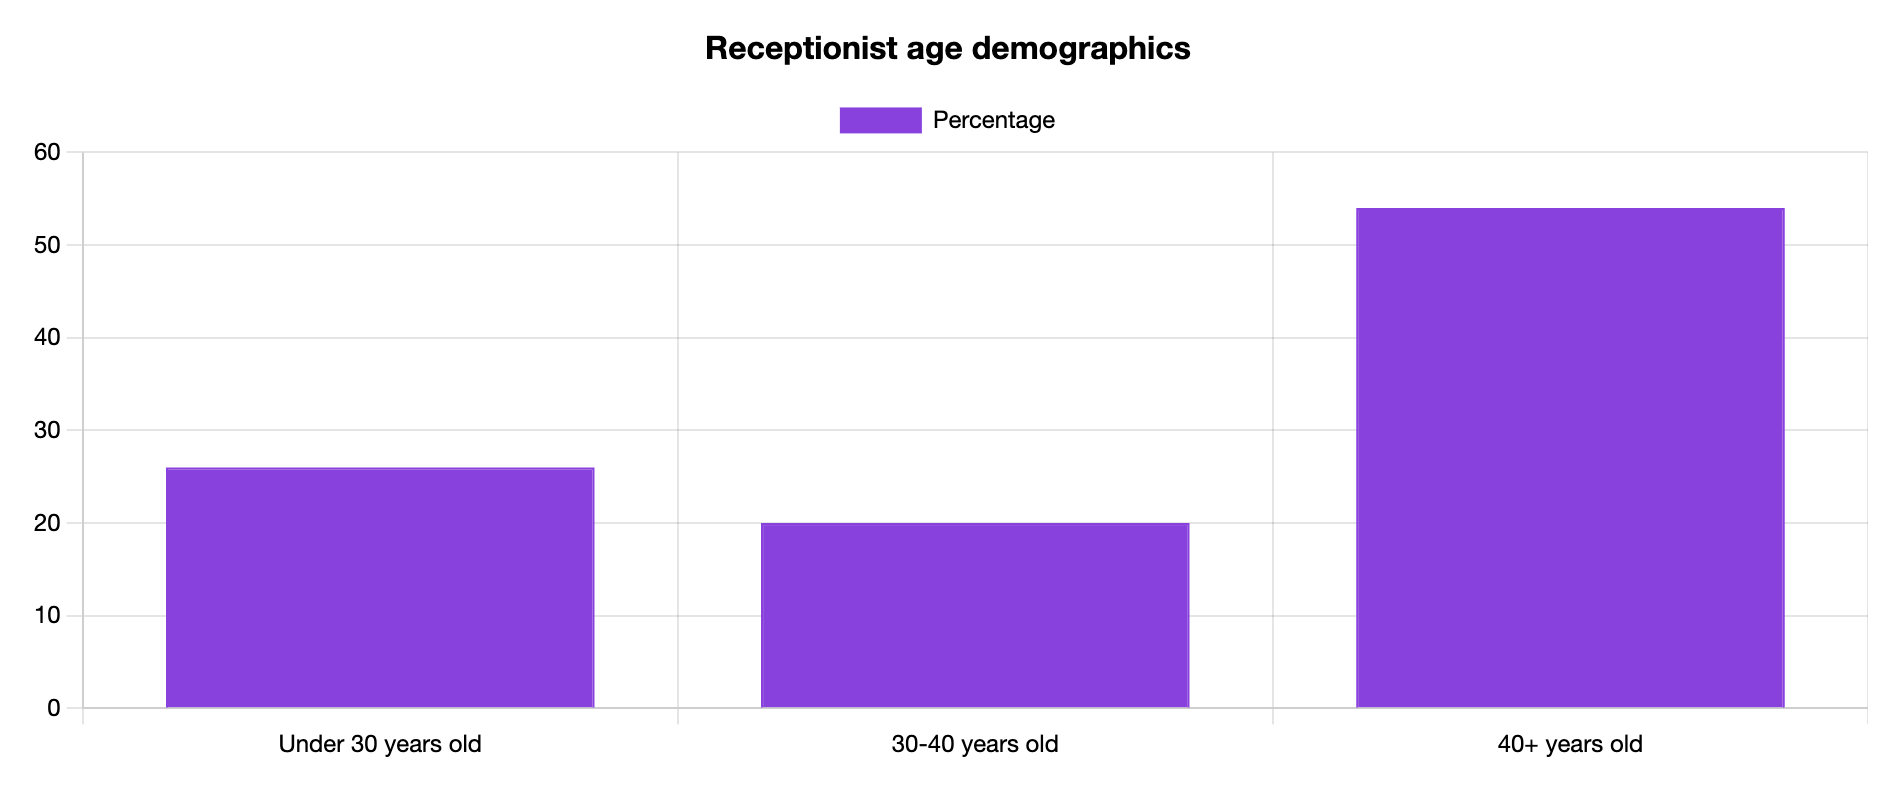
More than half of the Receptionists (54%) are older than 40.
Receptionist Employment Type Statistics
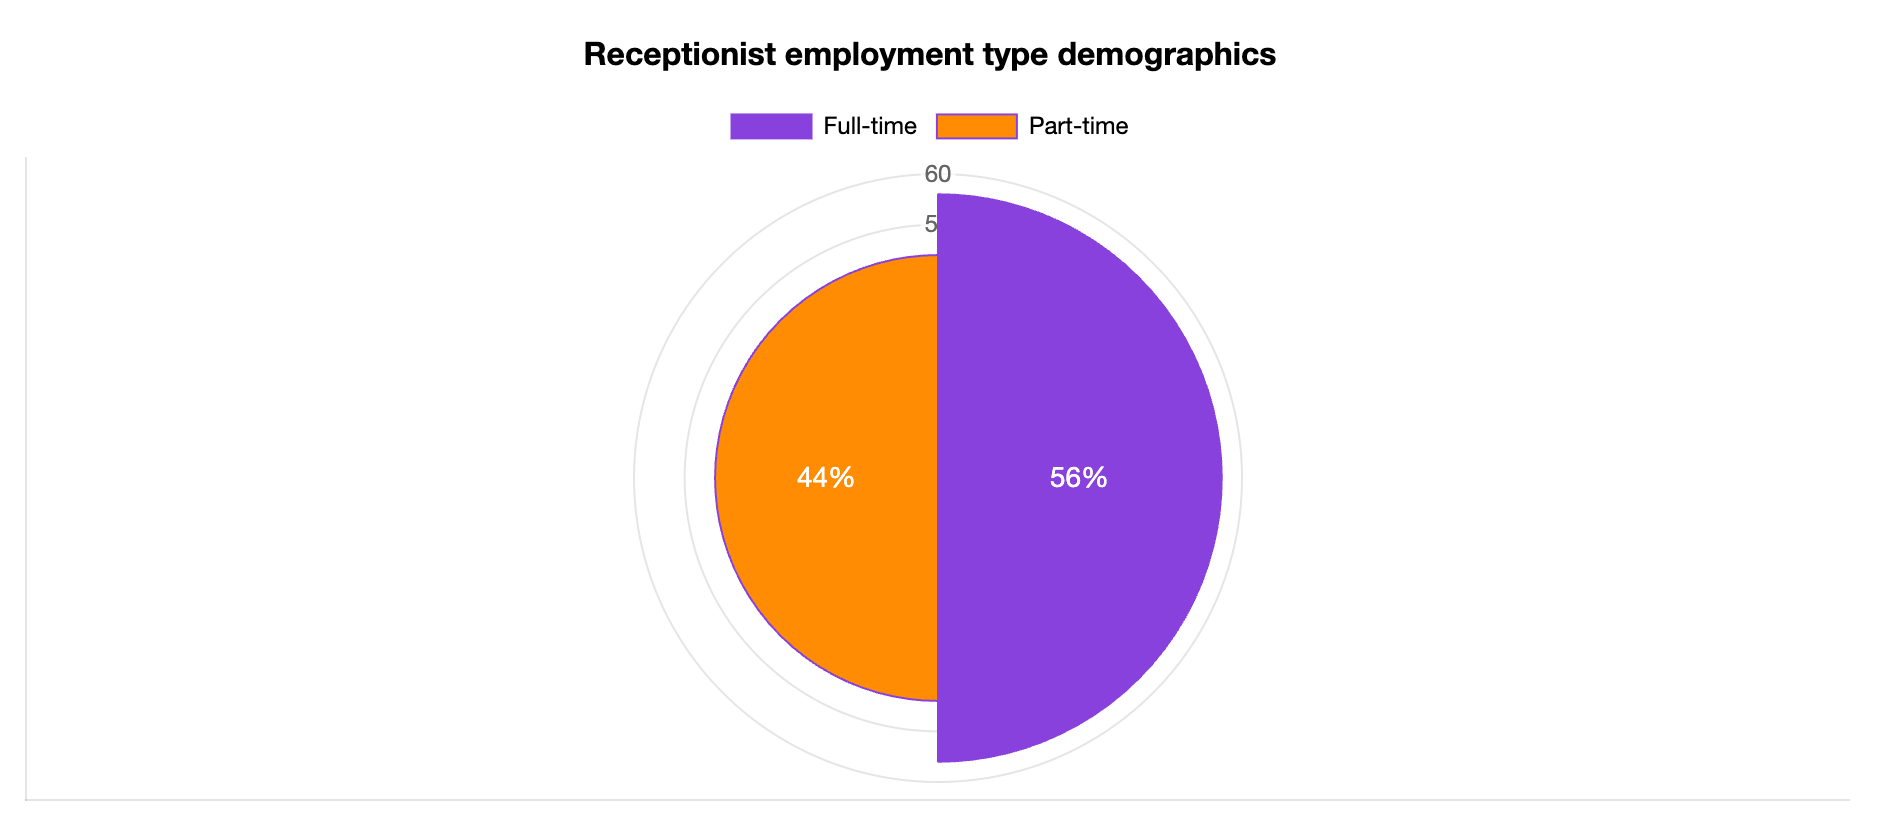
There’s a slight difference in the number of Receptionists who work full-time (56%) in comparison to those who are hired part-time (44%).
This is similar to another hospitality role that is female dominated, the Cashier. See more on the Cashier demographics page.
Receptionist Ethnicity and Race Statistics
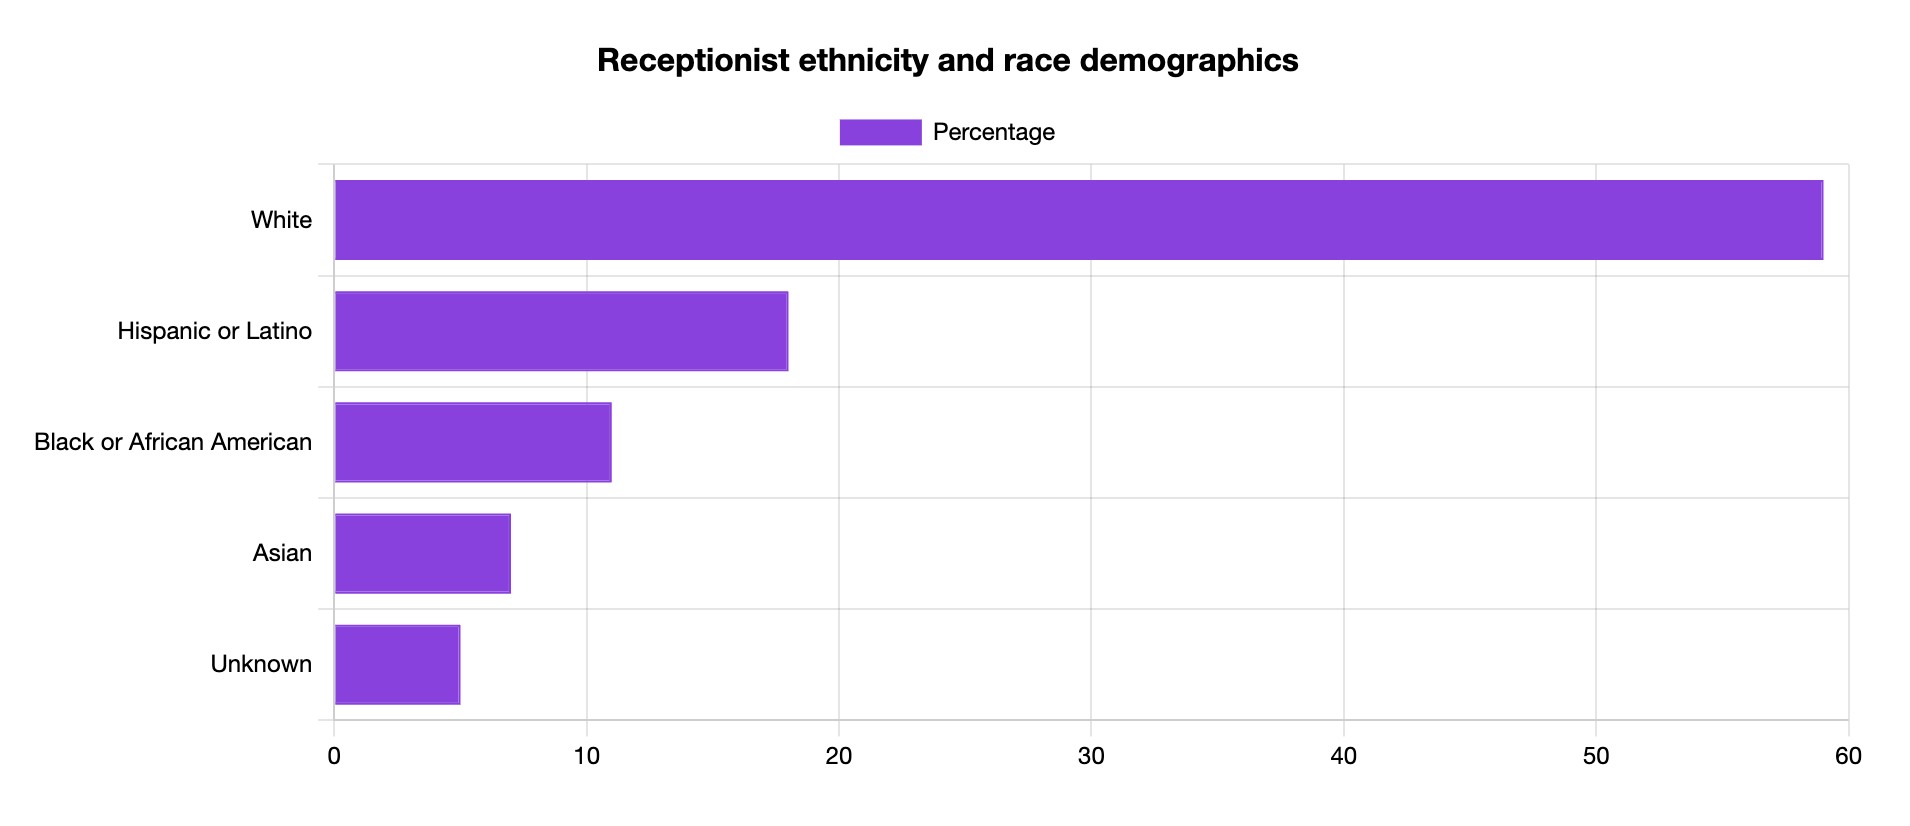
The vast majority of the Receptionists are white (59%), while Asian Americans account for only 7% of the workforce.
Receptionist Education Statistics
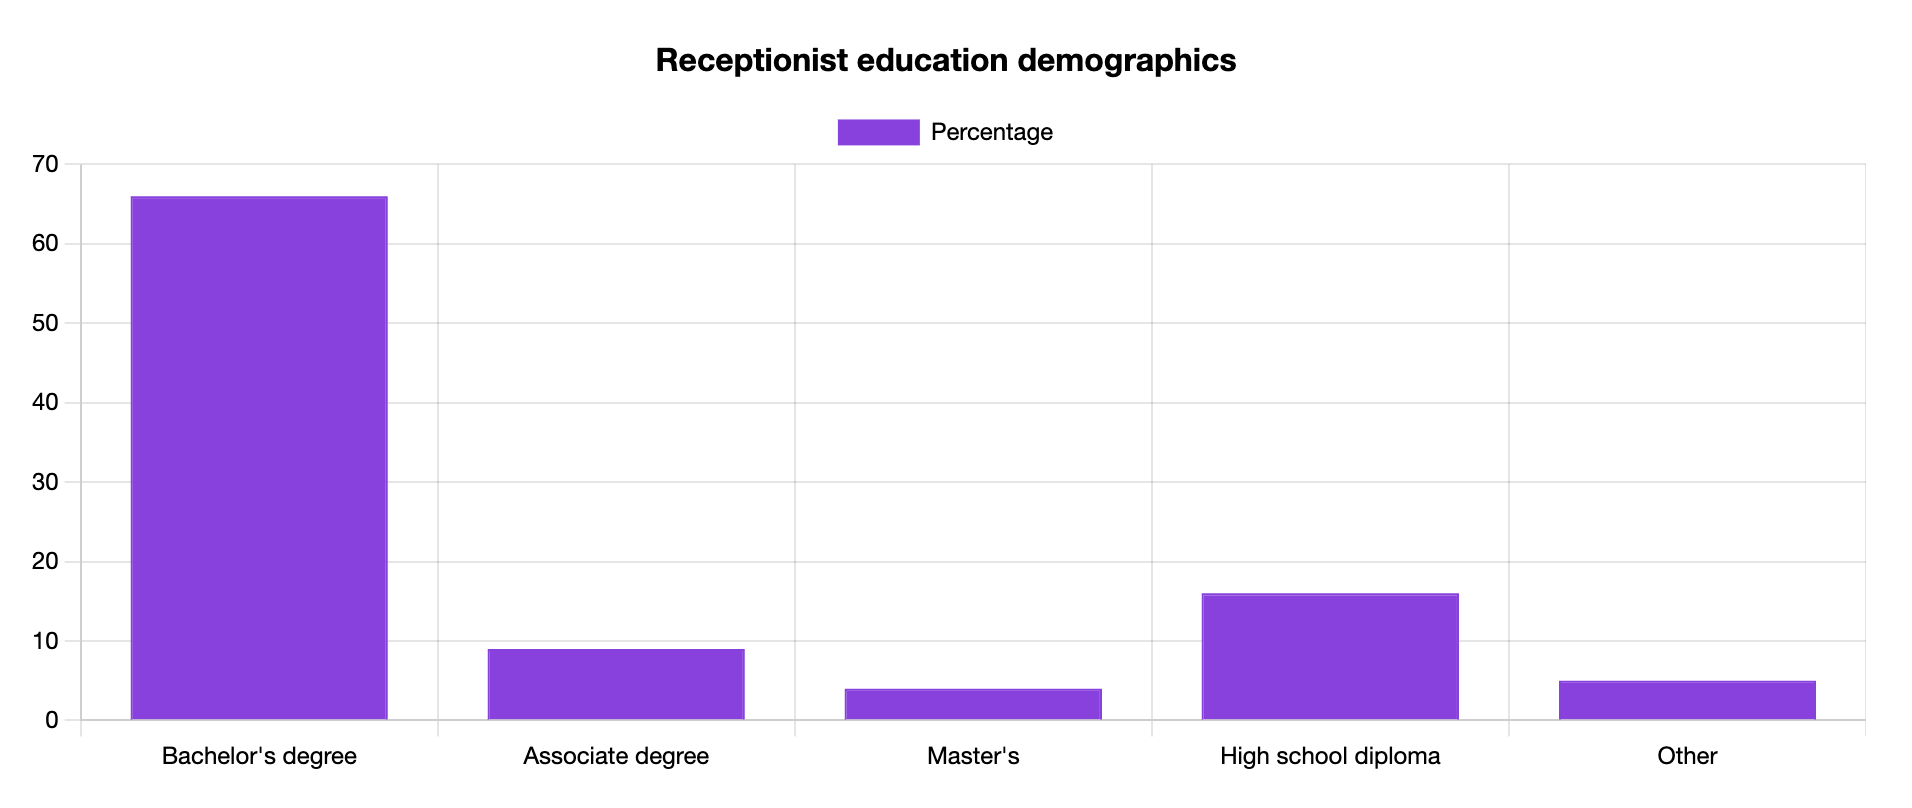
Given the current competitiveness of the job market, a large number of Receptionists (66%) have earned bachelor’s degrees.
This is different from Porters who, even though also an entry-level role, don't have such a high number of individuals with the bachelor's degree.
See more on our Porter demographics page.
Receptionist Tenure Statistics
An overwhelming 72% of Receptionists stay in their roles for just under two years.
Receptionist Jobs by Industry
Receptionists are usually hired in healthcare institutions, such as hospitals and clinics.
Receptionist Jobs by Company Size Statistics
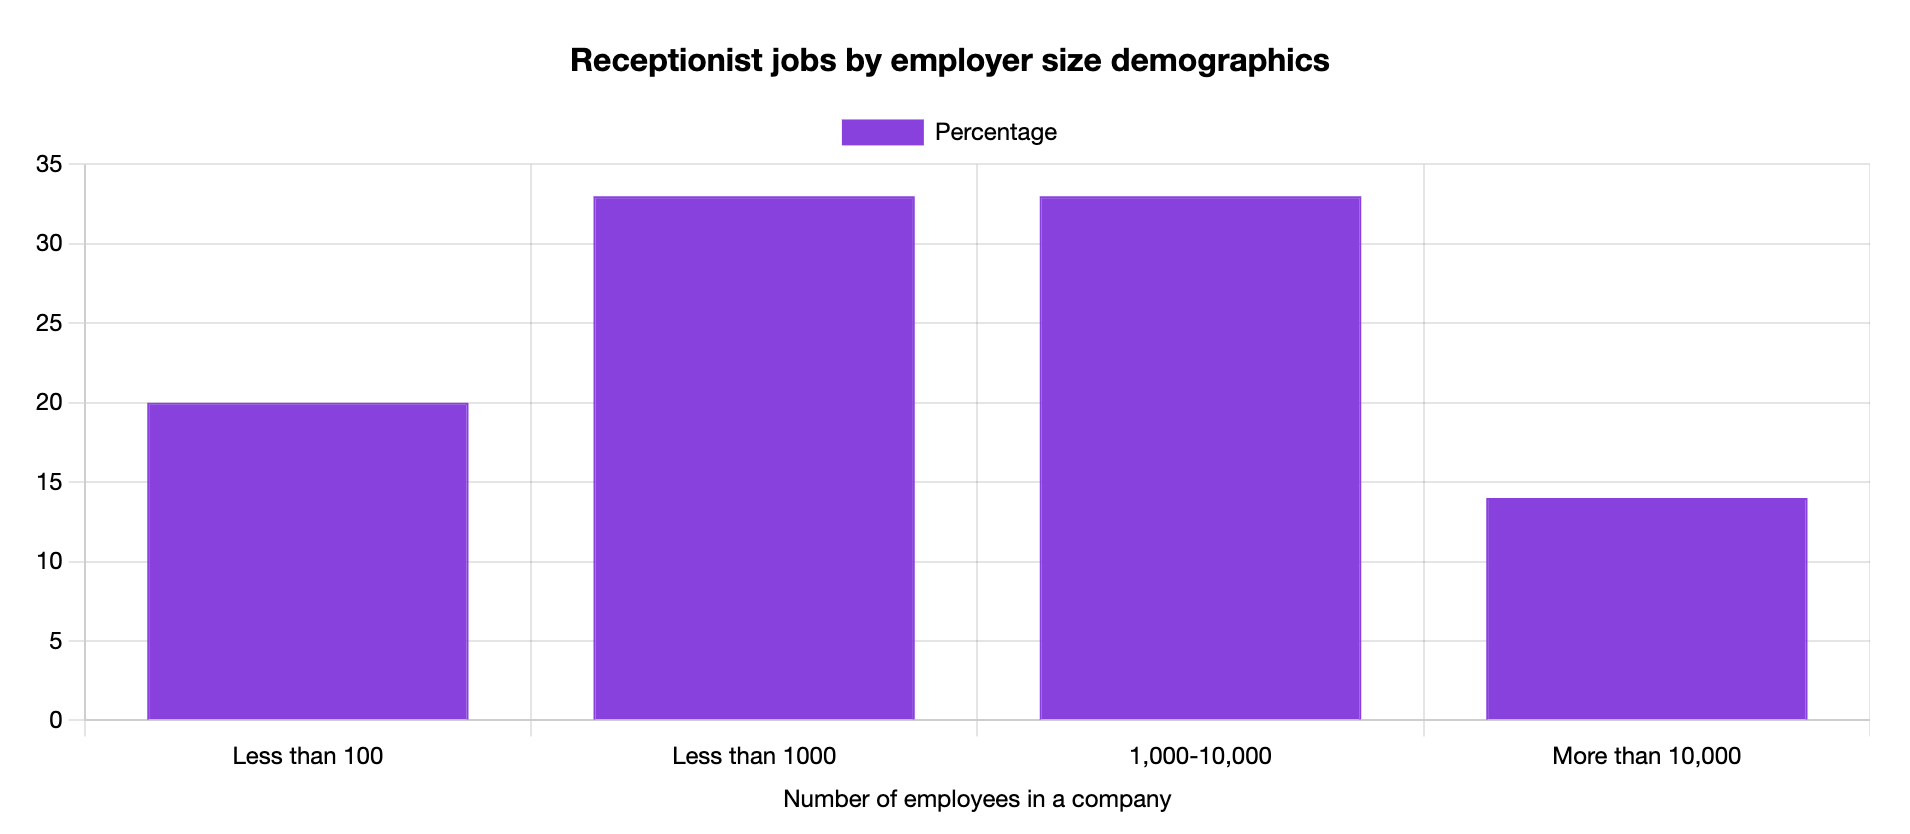
The largest portion of Receptionists (66%) work in medium-sized companies that hire 100 to 10,000 employees.
Receptionist Languages Spoken
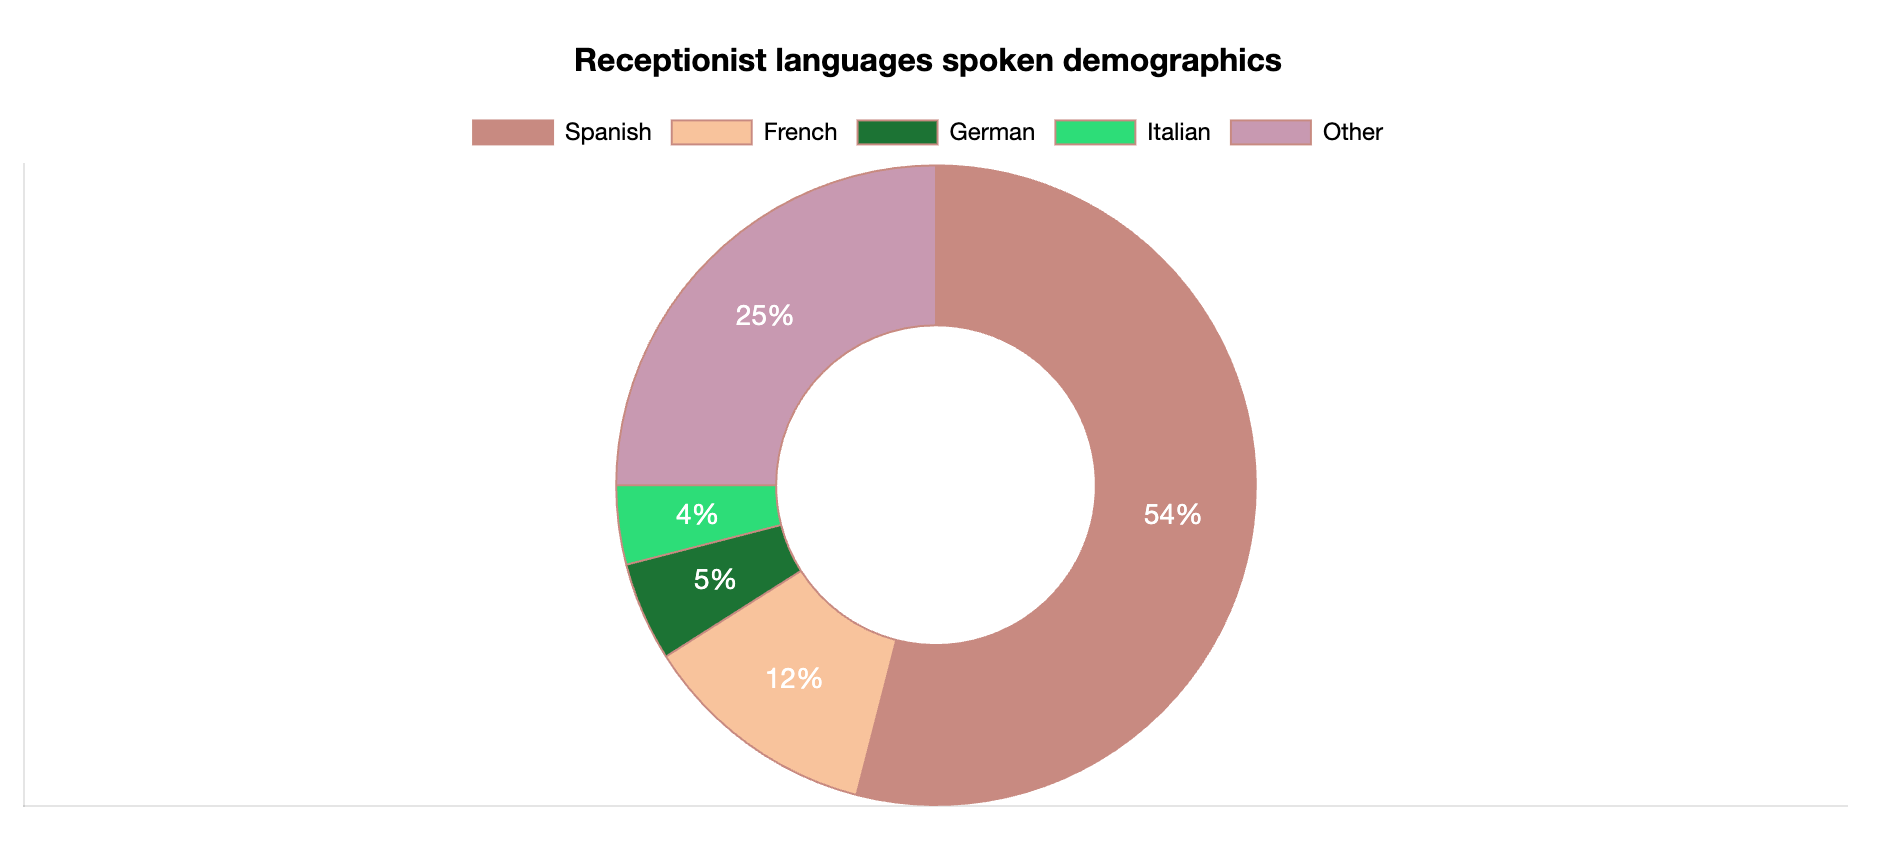
In addition to English, 54% of the Receptionists are fluent in Spanish as a second language, followed by 13% of those who speak French.
5 More Receptionist Stats
- Only 2% of Reception Clerks stay in their roles for more than 11 years
- It is estimated that the U.S. will hire a further 137,800 Receptionist in the next decade
- The Receptionist job market is expected to grow 0.4% by 2032
- In 2023, there were 1,054,500 positions available for this job title
- There are 0.8% Native Americans working in this industry
Receptionist Statistics and Demographics Data
We’ve developed an in-house demographics and statistics method that we use to break down some of the most interesting job aspects of being a Receptionist.
