Bartender Demographics and Statistics in the US – 2026
We’ve compiled a list of the most important Bartender statistics and included them in this article. Based on jobs people found through OysterLink, we were able to conclude the following:
- There are 711,140 Bartenders working in the United States
- The Bartender occupation is expected to grow at a 3% rate, according to the Bureau of Labor Statistics, as employment demand rises in nightclubs, restaurants, and bars across the U.S.
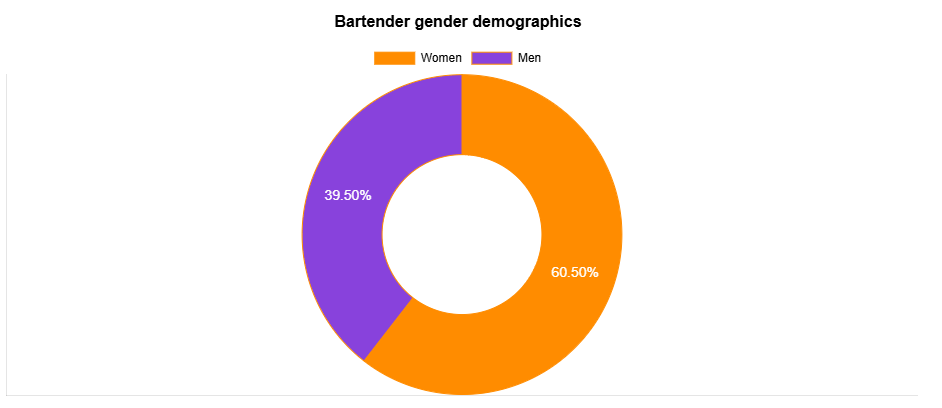
- 60.5% of Bartenders currently employed are women, and 39.5% are men
- Bartenders in the U.S. average 34 years old for men and 30 for women, reflecting a youthful workforce often entering the role with minimal prior experience
Bartender Employment Statistics
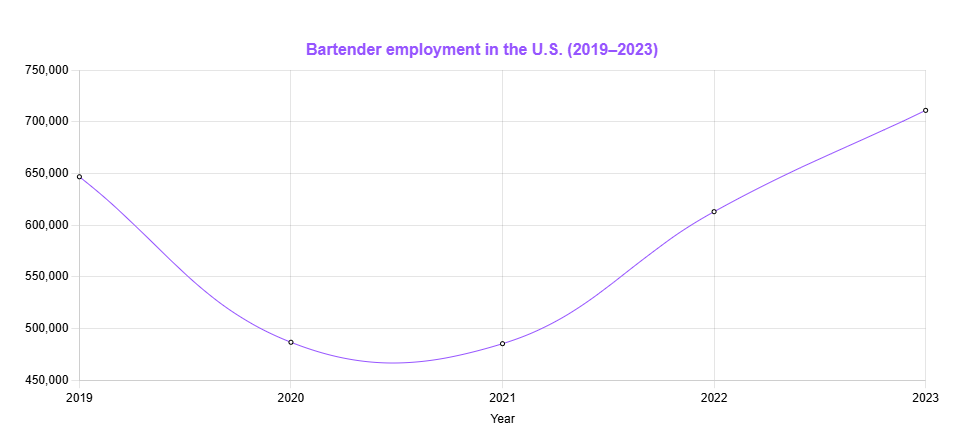
We’ve illustrated how demand for Bartenders has grown over the past couple of years using the graph above.
You can see the obvious dip in 2020 when restaurants had to close down, but there’s been steady growth since then.
Gender Breakdown and Statistics for Bartenders in the US
Most of the Bartenders currently working in the U.S. are female. This demographics is different from other bar roles, as you can see on our Barback demographics page.
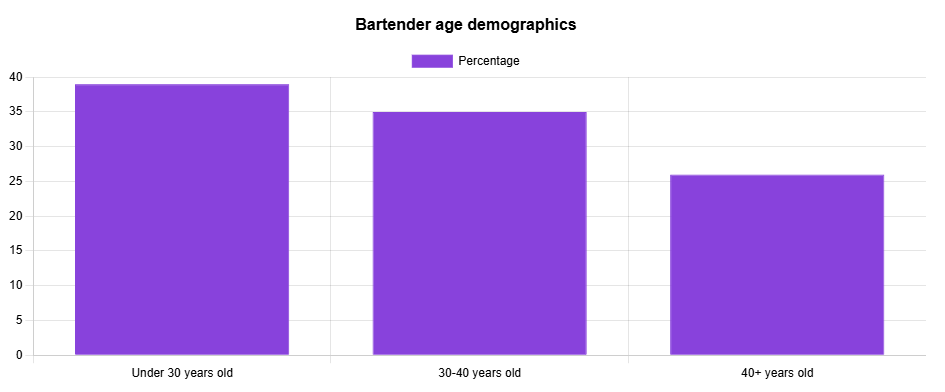
Bartender Age Statistics
39% of Bartenders currently employed are people who are under 30 years old. A further 35% are people aged 30 to 40, and 26% of the workforce consists of people aged 40 years or older.
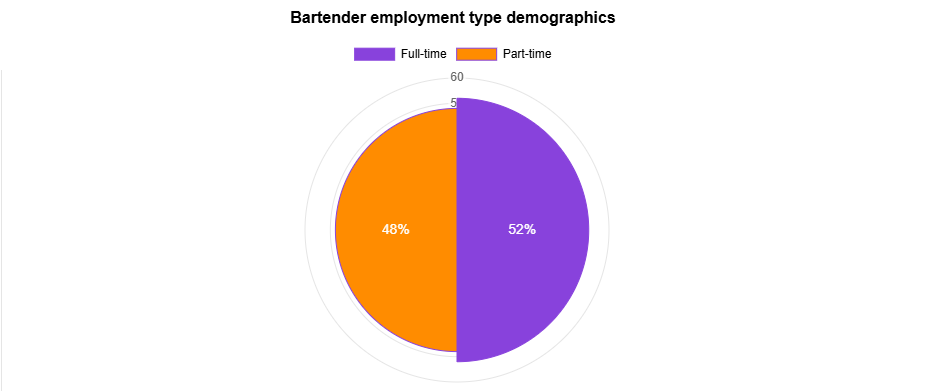
Bartender Employment Type Statistics
Just over half of all Bartenders are employed full-time, while 48% work part-time in various establishments such as bars and restaurants.
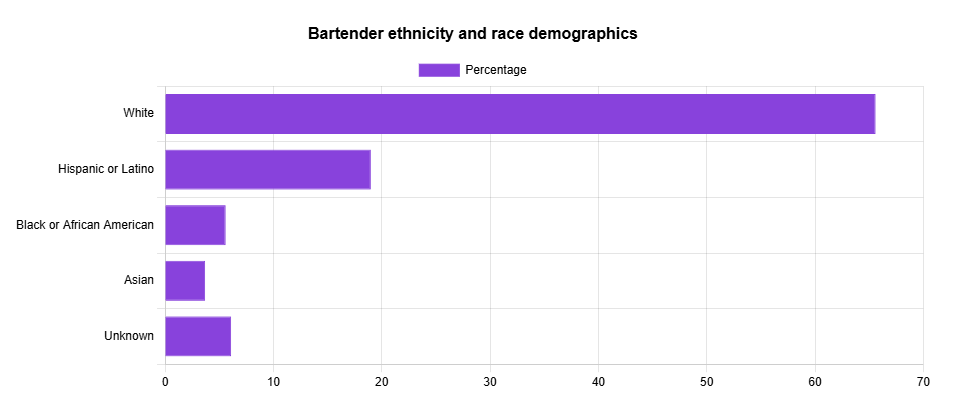
Bartender Ethnicity and Race Statistics
The majority of people working as Bartenders are white, at 65% of the workforce. Around 19% of Bartenders are Hispanic or Latino, 5.6% are Black or African American and 6.1% were either mixed or didn’t want to answer. You can see the full breakdown in the chart below.
Bartender Education Statistics
Some 45% of Bartenders have a bachelor’s degree, and 22% of them have a high school diploma or a GED. Just 22% of Bartenders have an associate degree, as seen by the chart below.
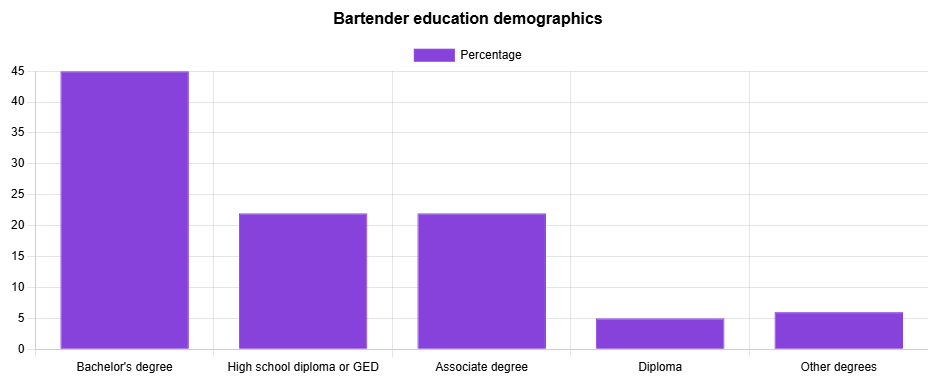
By contrast, most Waiters/Waitresses only have a high school diploma since it's an entry-level position that doesn't require experience or higher education.
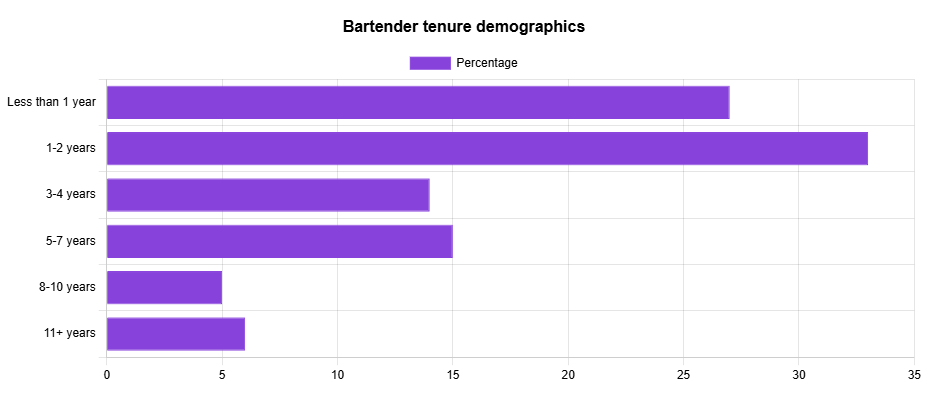
Bartender Tenure Statistics
Tenure simply shows how long Bartenders remain working in their role before moving on to better-paying roles or completely switching careers.
Most Bartenders, some 33% of them, remain in this role for one to two years, during which they learn useful Bartender skills. However, 27% don’t even remain employed as Bartenders for over a year. Just 6% of Bartenders make this position their life-long career and remain in the role for over 11 years, as seen in the graph below.
Bartender Industry Statistics
Restaurants and other dining places employ the most Bartenders with 319,880 employees working in this role. Drinking places where they serve alcoholic beverages, such as bars, are second, with 182,100 Bartenders. You can see the full breakdown below in the table.
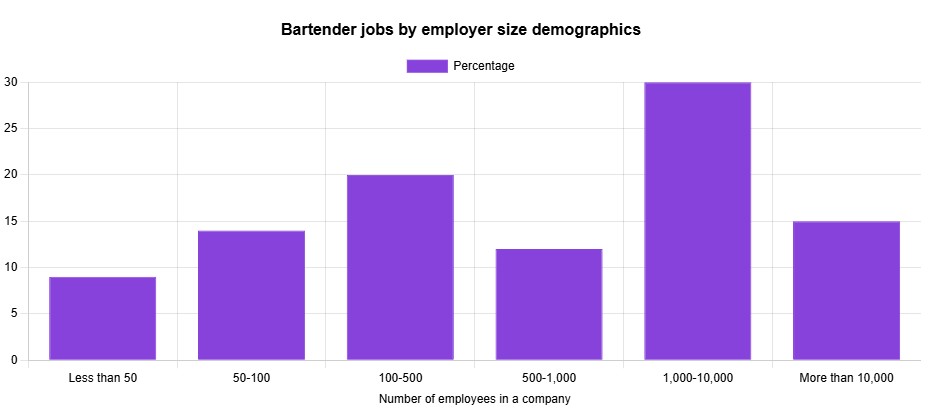
Bartender Jobs by Company Size Statistics
Most Bartenders work in large restaurant chains and establishments. Some 30% are employed in companies with 1,000-10,000 employees. Subsequently, 20% of them work in establishments with between 100 and 500 employees, and just 14% in establishments with 50 to 100 employees.
See the full breakdown here in this detailed graph.
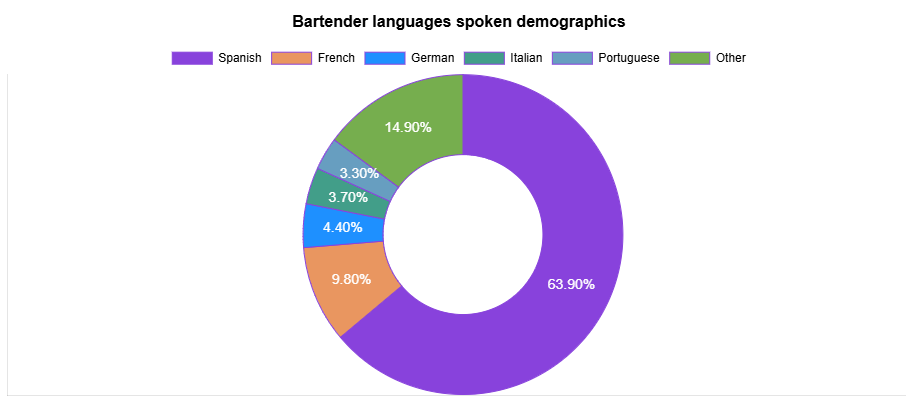
Bartender Languages Spoken
English aside, the most popular language spoken by Bartenders is Spanish. As much as 63.9% of Bartenders can communicate in Spanish. French and German are a close second and third at 9.8% and 4.4% respectively.
This breakdown of second languages is similar to other hospitality roles, as you can see on our Busser demographics page.
If you're looking for a job as a Bartender and you want to include the languages you speak in your resume, you can use our Bartender resume template and modify it to suit your needs.
5 More Bartender Statistics
- 65% of U.S. Bartenders identify as white, while 19% are Hispanic or Latino, and other races include Black or African American, according to demographic statistics.
- 52% of Bartenders work full-time, while 48% hold part-time jobs in establishments like hotels, nightclubs, and restaurants, making it a flexible occupation.
- About 45% of Bartenders have completed a bachelor’s degree, while others possess on-the-job training, allowing for diverse educational backgrounds in the role.
- Nearly one-third of all Bartenders work in companies with over 1,000 employees
- Some 64% of all Bartenders who speak a second language are fluent in Spanish
Bartender Statistics and Demographics Data
We collect data from multiple sources, including government websites and agencies. To see how exactly we calculate this data, check out our methodology page.

Written by Vukasin Petrovic
Vukasin is an experienced content creator with more than five years of writing and editing experience. With a background in English and an MFA in Creative Writing, he excels in digital marketing and copywriting, crafting narratives that engage the audience.

Reviewed by Stefan Petrov
With over 10 years of experience as a writer and editor, Stefan has worked in the automotive, IT, health and hospitality industries. Familiar with Google Search Console and other SEO tools like Ahrefs and Semrush, Stefan uses his experience to create content that's visually appealing to the user but also ranks in the SERPs.